- Higher starting yields in global bond markets offer an attractive risk/reward trade-off.
- US equity valuations looked stretched, while international markets offer better value.
- Some long-term multi-asset investors may benefit from increasing their exposure to global bonds.
Directing investors to an appropriate exposure to global equities and global bonds might be the most important investment guidance that a financial adviser can offer for many clients.
Studies have found, time and time again, that a strategic allocation to global equities and global bonds gives long-term investors a good chance of investment success1.
And Vanguard’s latest multi-asset return forecasts suggest many investors might benefit from increasing their exposure to global bonds at the expense of equity market exposure.
That’s primarily because higher starting yields have greatly improved the risk-return trade-off in fixed income, while stretched US equity valuations dampen our long-term return outlook for world’s largest stock market.
Bonds are back, tell a friend
Speculation around interest rate policy decisions may fuel short-term volatility in bond markets, but the case for holding bonds in a multi-asset portfolio is as strong as ever.
While 2022 saw global bonds sell-off as interest rates began to rise, that short-term pain has paved the way for a longer-term gain for bond investors – and the higher long-term yields create a cushioning effect for future bond returns: If the long-end of the yield curve falls from today’s level, bond holdings would rise in value while also paying relatively high coupons. And even if long-term interest rates were to rise, the higher coupons would offset some of the pain associated with the corresponding capital loss as bond prices move inversely to interest rates.
We call that cushioning effect the ‘coupon wall’. By our calculations, sterling investors have an 88% chance of seeing positive returns from their bond exposures regardless of whether rates rise or fall in 2025. That’s compared with a 43% probability in 2021, when bond yields were a lot lower.
Stretched valuations: A long-term hurdle
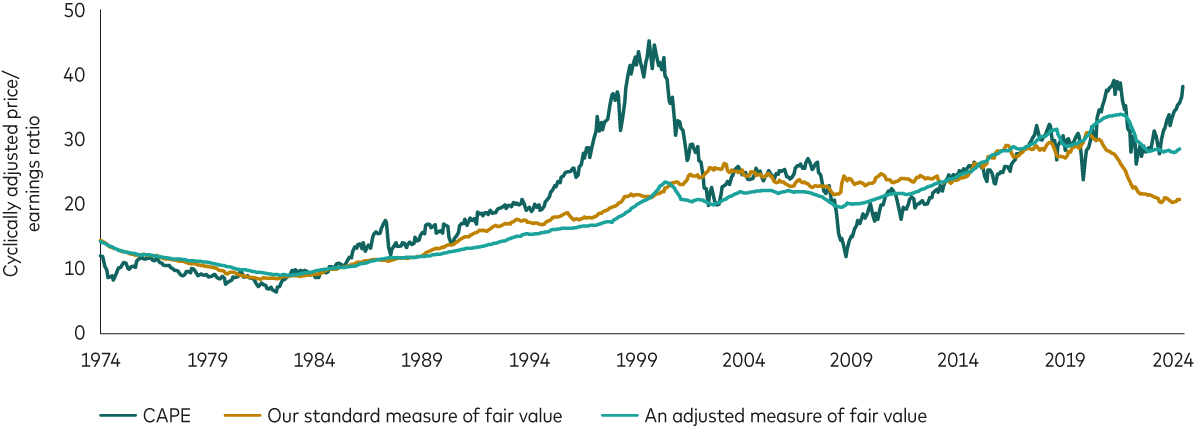
No matter how you cut it, US equity valuations are stretched. Even when we adjust our measure of ‘fair value’ to consider contemporary nuances relative to history, US equities look expensive. The chart below shows the cyclically adjusted price-to-earnings (CAPE) ratio for the US stock market (green line) as well as our standard measure of ‘fair value’ (gold line).
We also show an adjusted measure of ‘fair value’ (light green line) that considers the increased weight of the technology sector in the S&P500. This analysis factors in the competitive advantages that many of those companies enjoy, including winner-takes-all business models that have translated into earnings resilience despite rising rates. This adjusted measure also adapts for the low long-term borrowing costs that many large US companies locked in before 2022.
When adjusting for these specific and unique factors relative to historic averages, it paints a less-severe picture of US overvaluation—but US equities look stretched nonetheless.
US CAPE versus Vanguard’s two measures of ‘fair value’

Notes: The chart shows the CAPE ratio for US equities, measured by the MSCI USA Index until 30 April 2003, and the MSCI US Broad Market Index thereafter. It also depicts our ‘standard’ fair-value estimate based on a statistical model considering interest rates and inflation, and an adjusted fair-value estimate taking into account the recent divergence between companies’ after-tax cost of debt and market yields, and the rising share of the technology sector in the overall equity index.
Source: Vanguard calculations, based on data from Bloomberg, from 31 December 1973 to 30 November 2024.
The bottom line here is that replicating the past decade’s stellar returns will not be an easy feat for the US stock market—it would require unprecedented earnings growth or historically high valuations. But the time horizon matters. Over the short term, our analysis suggests that if economic growth and earnings hold up, US equities could sustain elevated valuations. However, as the horizon extends, growth and earnings impacts diminish, with valuations eventually dominating returns as a ‘fundamental gravity’.
Non-US equity markets offer better long-term return prospects thanks to more attractive starting valuations, which is why a globally diversified exposure to equity markets remains a sensible position.
Bond with clients
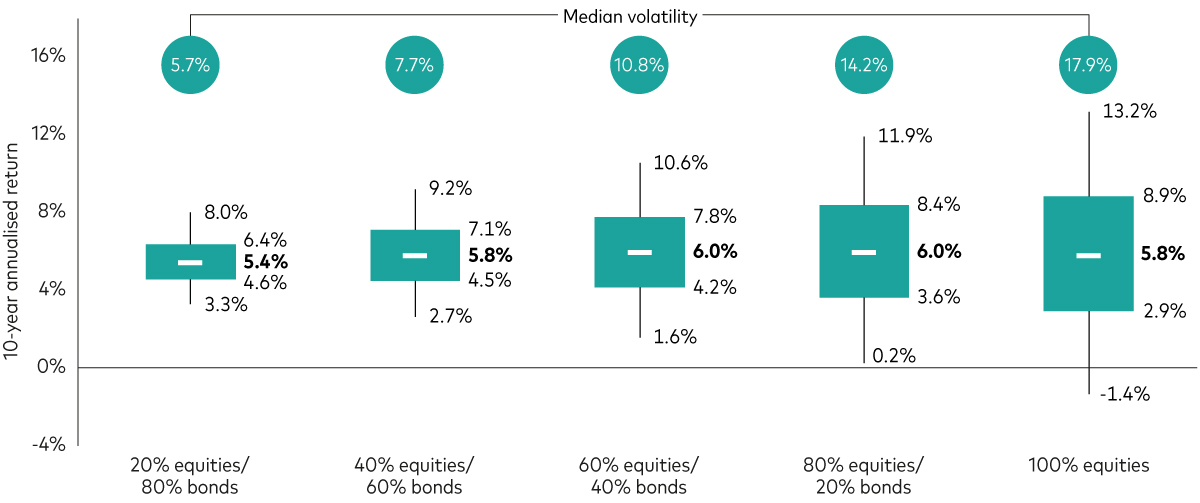
When we put together our equity and bond market return outlooks, we see attractive returns on offer for more defensive portfolios. The next chart shows our 10-year return expectations for sterling investors for five multi-asset portfolios. The bold numbers in black are our current annualised median return expectations for the next 10 years with a range of possible outcomes shown around it, including median volatility expectations for each portfolio.
The median return expectations across the range are similar but the expected volatility increases significantly as we go up the risk spectrum. Importantly, while the median annualised return expectation for the 60% equity portfolio is close to its 25-year historical average, we expect above-average returns for the 20% and 40% equity portfolio and below-average returns for the 80% and 100% equity portfolios2.
In short, long-term investors are less likely to be rewarded for taking more equity risk.
10-year expected returns across multi-asset portfolios

Any projections should be regarded as hypothetical in nature and do not reflect or guarantee future results.
Notes: The forecast corresponds to the distribution of 10,000 VCMM simulations for 10-year annualised nominal returns in GBP for multi-asset portfolios highlighted here. Portfolio returns do not take into account management fees and expenses, nor do they reflect the effect of taxes. Returns do reflect the reinvestment of income and capital gains. Indices are unmanaged; therefore, direct investment is not possible. Equities comprise UK equities and global ex-UK equities. Bonds comprise UK agg. bonds and global ex-UK agg. bonds. UK equity home bias: 25%. UK fixed income home bias: 35%.
Sources: Vanguard calculations, as at 8 November 2024.
IMPORTANT: The projections and other information generated by the VCMM regarding the likelihood of various investment outcomes are hypothetical in nature, do not reflect actual investment results and are not guarantees of future results. Distribution of return outcomes from the VCMM are derived from 10,000 simulations for each modelled asset class. Simulations are as at 8 November 2024. Results from the model may vary with each use and over time.
Diversified multi-asset investors can achieve reasonable long-term returns across the risk spectrum with higher bond-allocation portfolios offering better risk-adjusted returns by our estimates. Some investors may even benefit from moving down the risk spectrum by increasing their exposure to fixed income markets.
1 For example, see Gary P. Brinson, L. Randolph Hood, and Gilbert L. Beebower, 1995. ‘Determinants of portfolio performance.’ Financial Analysts Journal 51(1):133–8. (Feature Articles, 1985–1994).
2 The historical average return of the portfolios between 31 January 1999 and 31 December 2024 have been 4.9%, 5.4%, 5.9%, 6.3% and 6.6% for the 20%, 40%, 60%, 80% and 100% equity portfolios, respectively. The equity portion of the portfolios is measured by the MSCI UK Total Return Index and MSCI All Country World ex-UK Total Return Index with a UK home bias of 25%. The bond portion of the portfolios is measured by the Bloomberg Sterling Aggregate Index and the Bloomberg Global Aggregate ex Sterling Index Sterling Hedged with a UK home bias of 35%. Due to data availability, the bond portion of the portfolio is measured by the Bloomberg Global Aggregate Index Sterling Hedged before 31 August 2008.
IMPORTANT: The projections or other information generated by the Vanguard Capital Markets Model® regarding the likelihood of various investment outcomes are hypothetical in nature, do not reflect actual investment results, and are not guarantees of future results. VCMM results will vary with each use and over time. The VCMM projections are based on a statistical analysis of historical data. Future returns may behave differently from the historical patterns captured in the VCMM. More important, the VCMM may be underestimating extreme negative scenarios unobserved in the historical period on which the model estimation is based.
The Vanguard Capital Markets Model® is a proprietary financial simulation tool developed and maintained by Vanguard’s primary investment research and advice teams. The model forecasts distributions of future returns for a wide array of broad asset classes. Those asset classes include US and international equity markets, several maturities of the U.S. Treasury and corporate fixed income markets, international fixed income markets, US money markets, commodities, and certain alternative investment strategies. The theoretical and empirical foundation for the Vanguard Capital Markets Model is that the returns of various asset classes reflect the compensation investors require for bearing different types of systematic risk (beta). At the core of the model are estimates of the dynamic statistical relationship between risk factors and asset returns, obtained from statistical analysis based on available monthly financial and economic data from as early as 1960. Using a system of estimated equations, the model then applies a Monte Carlo simulation method to project the estimated interrelationships among risk factors and asset classes as well as uncertainty and randomness over time. The model generates a large set of simulated outcomes for each asset class over several time horizons. Forecasts are obtained by computing measures of central tendency in these simulations. Results produced by the tool will vary with each use and over time.
The primary value of the VCMM is in its application to analysing potential client portfolios. VCMM asset-class forecasts—comprising distributions of expected returns, volatilities, and correlations—are key to the evaluation of potential downside risks, various risk–return trade-offs, and the diversification benefits of various asset classes. Although central tendencies are generated in any return distribution, Vanguard stresses that focusing on the full range of potential outcomes for the assets considered, such as the data presented in this paper, is the most effective way to use VCMM output.
The VCMM seeks to represent the uncertainty in the forecast by generating a wide range of potential outcomes. It is important to recognise that the VCMM does not impose “normality” on the return distributions, but rather is influenced by the so-called fat tails and skewness in the empirical distribution of modelled asset-class returns. Within the range of outcomes, individual experiences can be quite different, underscoring the varied nature of potential future paths. Indeed, this is a key reason why we approach asset-return outlooks in a distributional framework.
Investment risk information
The value of investments, and the income from them, may fall or rise and investors may get back less than they invested.
Important information
This is directed at professional investors and should not be distributed to, or relied upon by retail investors.
This is designed for use by, and is directed only at persons resident in the UK.
The information contained herein is not to be regarded as an offer to buy or sell or the solicitation of any offer to buy or sell securities in any jurisdiction where such an offer or solicitation is against the law, or to anyone to whom it is unlawful to make such an offer or solicitation, or if the person making the offer or solicitation is not qualified to do so. The information does not constitute legal, tax, or investment advice. You must not, therefore, rely on it when making any investment decisions.
The information contained herein is for educational purposes only and is not a recommendation or solicitation to buy or sell investments.
Issued by Vanguard Asset Management Limited, which is authorised and regulated in the UK by the Financial Conduct Authority.
© 2025 Vanguard Asset Management Limited. All rights reserved.