How should clients allocate across active and index investments? It’s a challenging decision with many components. Imagine for a moment that you live in a world with only two fund options: an index fund and an actively managed fund with similar levels of volatility. You, the adviser, are trying to determine how to structure your client’s two-fund portfolio.
The expected relative return of the active fund is a function of two variables – the expected outperformance of the active fund, known as the ‘gross alpha expectation’ and the cost. If the resulting ‘net relative performance’ (gross alpha minus cost) is expected to be positive, the simple choice would be to allocate 100% to the active fund. If, on the other hand, the resulting net alpha of the active fund is expected to be negative, the choice would be equally straightforward: allocate 100% to the index fund. This approach results in a binary choice – all active or all index.
This dynamic is often at the heart of the active/passive debate, which tends to focus on all-or-nothing views and recommendations. Proponents of index investing point to research demonstrating that the median active manager underperforms after costs and that outperformers are difficult to recognise in advance. Meanwhile, proponents of active investing argue that despite the underperformance of the median active fund, many active managers do add value and the impact of possible outperformance can be significant. And the debate rages on.
We reject this basic, binary choice. Both active and index investments have potential benefits to a portfolio. Index funds offer low-cost benchmark tracking, leading to a tight range of relative returns. Active funds offer the potential for outperformance in exchange for a wider range of relative returns (in other words, greater uncertainty) and typically higher costs.
In addition to gross alpha and cost, let’s consider two more variables: active risk (defined as the uncertainty of future manager performance) and active risk tolerance (the degree to which an investor can tolerate this uncertainty). Now we can consider a more nuanced trade-off between active and passive by incorporating an ‘uncertainty penalty’ into our active expectations. This can help balance the potential positive impact of alpha expectations with the uncertainty of achieving a favourable outcome.
We can incorporate more details to help make our decision. For example, would it be prudent to invest in the active fund if it is expected to provide 0.10% net annualised outperformance? The modest size of the potential reward may not be substantial enough to justify a 100% allocation to the active fund given the uncertainty that the manager will achieve the expected outperformance.
What about a 5% allocation to this fund as part of an active/passive portfolio? What about 25%? How does the level of active risk inherent in the fund affect this decision? How does your client’s tolerance for taking on active risk affect it? And what if we increase or decrease the gross alpha expectation or cost associated with investing in the fund?
The active/passive decision framework
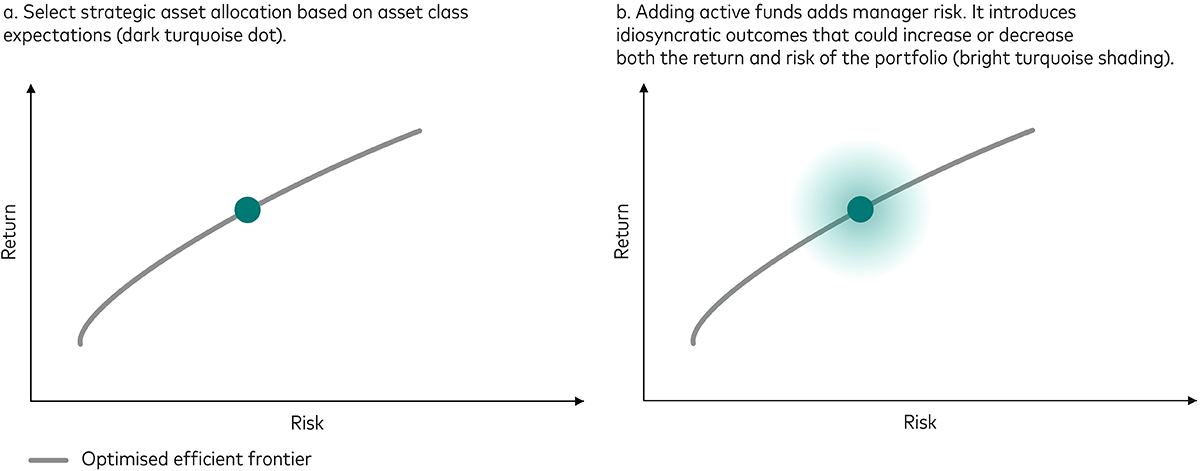
The portfolio construction process begins with establishing an appropriate strategic asset allocation. A secondary but important decision is how to implement the asset class and sub-asset class exposures determined in the first step. It is at this point that specific investment products are evaluated and the decision to allocate between active and passive investments will be made. The figure below illustrates the hierarchy of portfolio decisions.
Active-passive decision-making during portfolio construction
Past performance is not a reliable indicator of future results.
Note: Illustrations represent a hypothetical efficient frontier based on asset class expectations and do not represent a particular investment.
Source: Vanguard.
Vanguard research has affirmed the active/passive decision as a broad strategic decision rather than a regional or time period-specific one. This differs from the belief that active funds can best flourish in specific market segments or time periods. We find that neither the market segments nor the time of the market cycle ensures better performance. Instead, active management requires talent, low costs, and patience to prosper1.
Our framework considers the impact of four variables related to these tenets of active management success:
Gross alpha expectation: A judgement about talent
Gross alpha expectation is the anticipation of one’s ability to achieve successful outcomes. An adviser’s degree of gross alpha expectation is linked to their active manager selection skill and is a critical component of the active allocation decision. It is important to note that the expectation of alpha does not necessarily translate into actual alpha – not all decision-makers can be above average2. Because behavioural biases such as overconfidence can lead to unreasonable expectations, a realistic assessment is critical.
Each adviser will have their own methods of attempting to identify talented managers and developing a gross alpha expectation for them. This is typically best done through a rigorous due-diligence process combined with an understanding of alpha ranges and sensitivity to the probability of success.
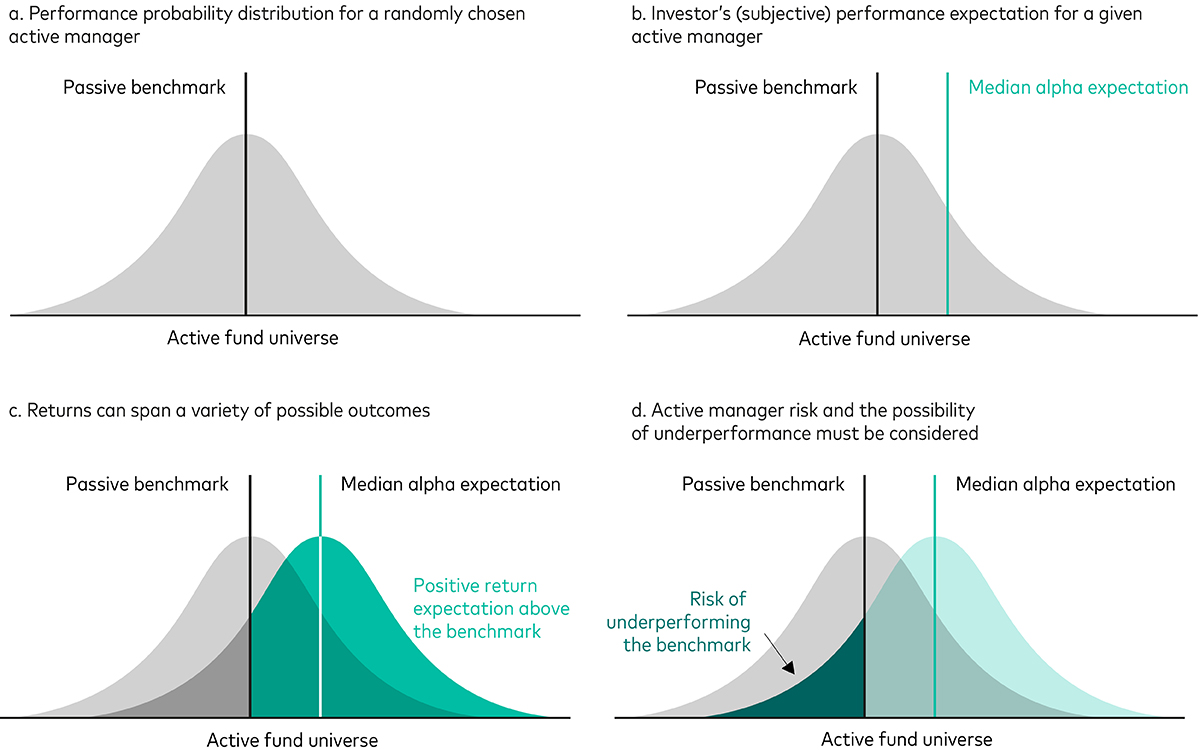
The level of expected alpha is a subjective measurement; actual future alpha levels are uncertain. In our framework, the term ‘alpha expectation’ carries a statistical meaning; the manager assessment can be thought of in terms of a distribution or bell curve of potential alpha outcomes, as shown in the figure below. The central tendency or mean of the distribution is the expected alpha and its standard deviation is a function of the manager’s active risk.
Alpha expectation is a median surrounded by a range of possible outcomes
Past performance is not a reliable indicator of future results.
Note: The pale and light green areas represent a hypothetical alpha distribution for a randomly chosen active manager for which the investor has a positive alpha expectation. The dark green area represents the hypothetical risk of underperforming the benchmark.
Source: Vanguard.
Cost: The enemy of net alpha
Evidence shows that the odds of outperformance increase as the cost of investing in active strategies reduces3. Indeed, low cost is the most effective quantitative factor that investors can use to improve their chances of success4. The cost of an active fund is also much more predictable than gross alpha. Gross alpha expectation and cost combine to form the net alpha expectation.
Active risk: Uncertainty quantified
Any active fund by its nature deviates from a benchmark in the attempt to improve returns. No active manager will outperform the market every day, every week, every month or even every year. Even those managers who have provided successful performance over longer time frames have typically experienced extended periods of underperformance5. This inconsistent pattern of relative returns can be quantified as active risk (in other words tracking error) or the volatility of a fund relative to its target benchmark, which can be thought of as the uncertainty the investor attaches to that particular active manager being able to outperform their benchmark. This is not to assume that higher tracking error necessarily leads to higher returns6, but rather that active funds have a range of different tracking errors7.
When compounded over time, active risk leads to variation in performance outcomes that can differ substantially from the central gross alpha expectation for a manager. Put another way, active risk and gross alpha expectations both have a straightforward statistical interpretation in terms of the standard deviation and mean derived from the bell curve of potential performance outcomes.
This distributional interpretation of active manager skill has been missing in the traditional active/passive debate, in which a manager’s alpha is typically thought of in terms of a point forecast. Incorporation of this distribution is the distinctive feature of our framework.
Active risk tolerance: A proxy for patience
The final element in evaluating the potential use of active strategies is the degree to which an investor is willing to take on active risk in the pursuit of outperformance. At the heart of the active/passive framework is a trade-off between an investor’s subjective alpha expectation and their subjective tolerance for downside risk. The active/passive decision arises from balancing the two.
How the variables affect allocation
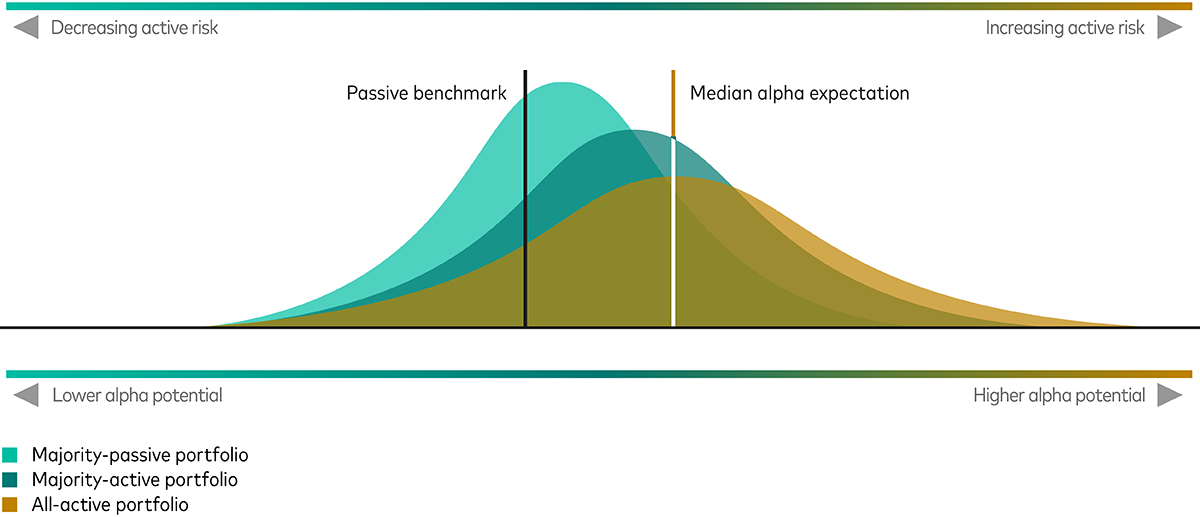
Under this interpretation of active/passive allocation as the solution to the active risk/return trade-off, an adviser can think of indexing as a diversifier of active manager risk. Clients uncomfortable with assuming the full amount of active risk associated with a given manager can mitigate the uncertainty by adding more of the ‘active-risk-free’ asset to the portfolio, as illustrated in the chart below. However, as they do so, any alpha expectation for that manager will also be diluted (as shown, the various distributions of portfolio outcomes become narrower and shift to the left). The appropriate allocation is the one that strikes the right balance between risk and expected active reward. The implication is that, even when an adviser attaches a positive alpha expectation to a manager, adding some indexing to the mix can mitigate manager risk.
Indexing may reduce active manager risk
Past performance is not a reliable indicator of future results.
Source: Vanguard.
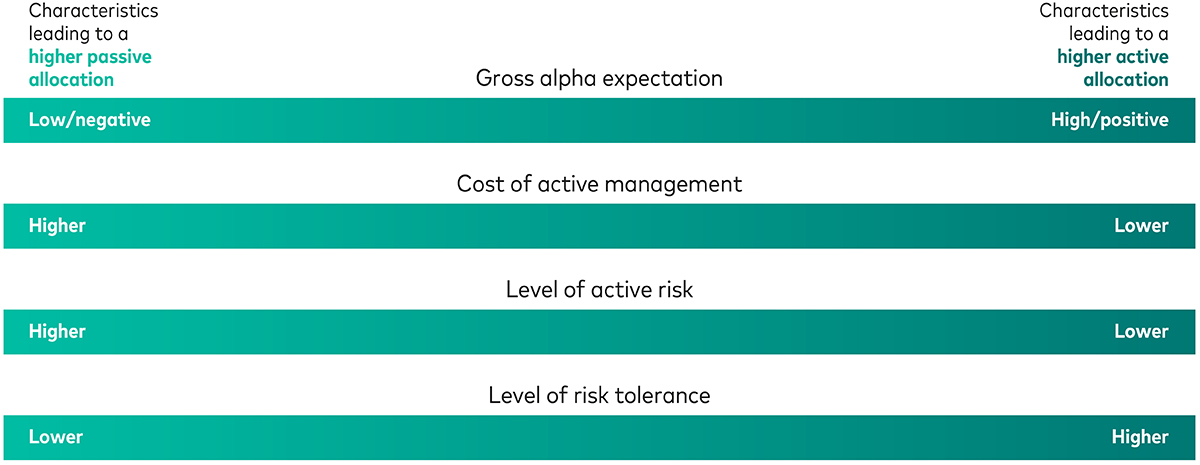
It is helpful to consider at a high level how underlying assumptions for each of our four variables would influence the allocation, as shown in the figure below.
Remember that these factors are to be evaluated with regard to their impact on the active selections being considered, not the index alternatives (we know index funds have a gross alpha expectation of zero, can be obtained at a very low cost and offer relatively little active risk). The attributes can be thought of in terms of a sliding scale, each one leading an investor to lean more towards active or passive.
Were we to stop here, we would be left with a completely qualitative allocation process. Any final decision using solely this approach would be arbitrarily based on implied assumptions. To avoid this, we have constructed a quantitative model that can consider different levels of each of the decision factors and better tailor solutions to a client’s specific circumstances.
Key decision factors and their impact on the active/passive mix
Source: Vanguard.
From qualitative to quantitative: A three-step process
Our quantitative simulation framework consists of three steps:
1. Build simulations for active managers.
2. Calculate the distribution of potential manager outcomes, including the associated underperformance risk.
3. Solve for the active/passive allocation that strikes the right balance between active risk and expected net alpha.
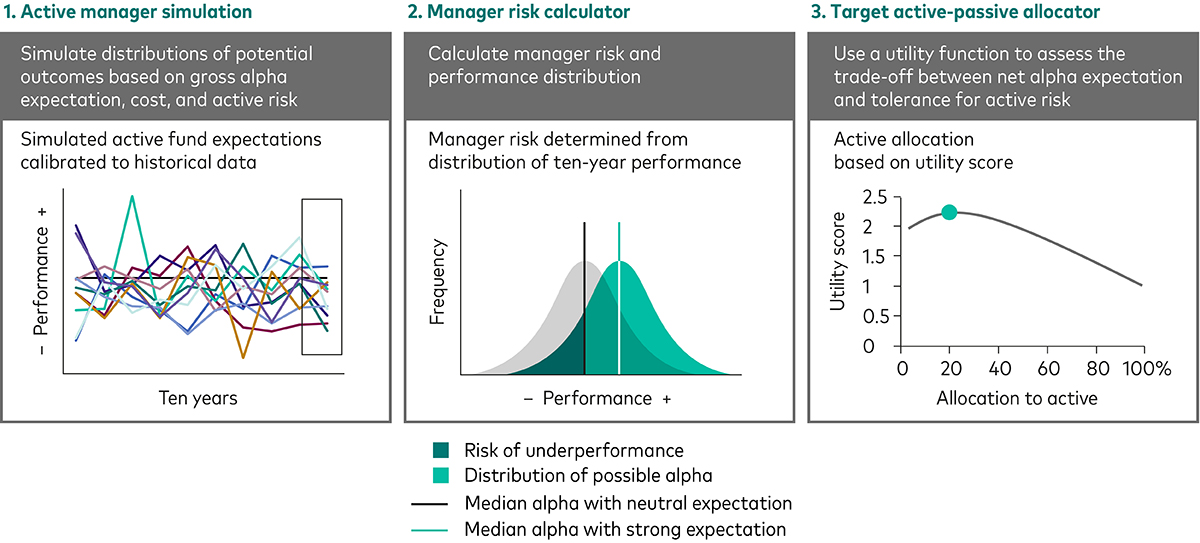
The simulation model shown below consists of three linked components: an active fund universe simulation, a manager risk calculation and a risk-return optimisation to find the allocation that best suits the client’s attitude to active risk.
The quantitative process
Gross alpha expectations of the active fund(s): Very low, low, neutral, high, very high
Cost (expense ratio) of the fund(s): Lower, moderate, higher
Active risk (tracking error) of the active fund(s): Lower, moderate, higher
Manager risk:
10,000 active manager simulations create a distribution of performance around alpha expectation.
Risk tolerance:
A utility function solves the risk-return trade-off for a given level of risk tolerance.
The Monte-Carlo method is a computational technique that uses random sampling to calculate a number of future scenarios. We generally sample from historical data or from a user-defined probability distribution. The potential outcomes become part of a series of simulations to help summarise a distribution of results.
Past performance is not a reliable indicator of future results.
Source: Vanguard.
Active manager simulation
The active manager simulation creates a theoretical universe of active mutual fund outcomes based on inputs of gross alpha expectation, cost and active risk. Each combination of these three variables is used to generate Monte-Carlo simulations of 10,000 different possible performance paths over a 10-year period.
We effectively create 45 universes of 10,000 funds for 45 different investor scenarios (five levels of gross alpha expectation multiplied by three levels of cost multiplied by three levels of active risk).
Performance distribution and manager risk
The second component of the model is the manager risk calculation. It compiles the distributions of each hypothetical 10,000-fund universe to calculate the range of uncertainty of the funds’ performance.
A simulated distribution of managers with a median net alpha expectation of zero is illustrated by the bell curve around the grey line in the centre of the figure above. A sample distribution of managers with a positive median net alpha expectation is illustrated by the curve around the purple line. Although the median for these 10,000 funds is positive, uncertainty remains, as evidenced by the range of possible outcomes and the sizeable tail risk of those with a negative net alpha.
Target active/passive allocation
The third component of the quantitative framework is a utility-function-based calculation. It uses active risk tolerance to assess the trade-offs between the active portfolio (represented by a distribution based on net alpha expectations and active risk) and the passive portfolio (represented by a single outcome based on its relatively low level of active risk). This is completed for each of the 45 investor scenarios across three different active risk tolerance levels, for a total of 135 active/passive allocations.
Utility-adjusted wealth creation over the simulated ten-year period is calculated for a full range of active/passive combinations. The suggested allocation is the one that maximises utility-adjusted wealth in each of the 135 scenarios. The figure below illustrates the sequence of decisions an investor needs to make when considering an active/passive mix.
Illustration of the active/passive decision flowchart
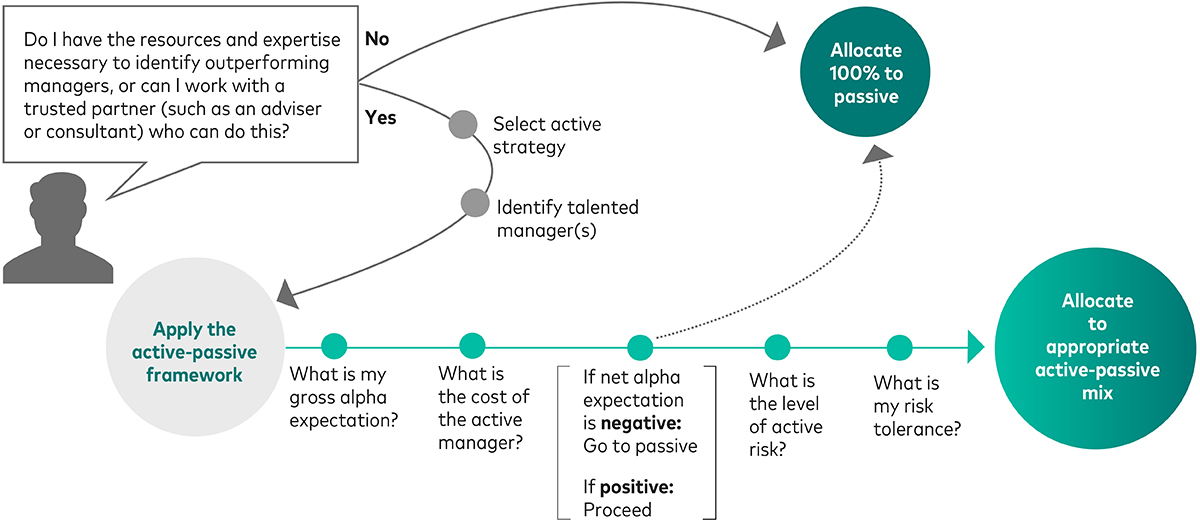
Note: This does not purport to promise better returns but rather to offer a clear decision-making process for use in establishing a target allocation.
Source: Vanguard.
When alpha and cost are everything
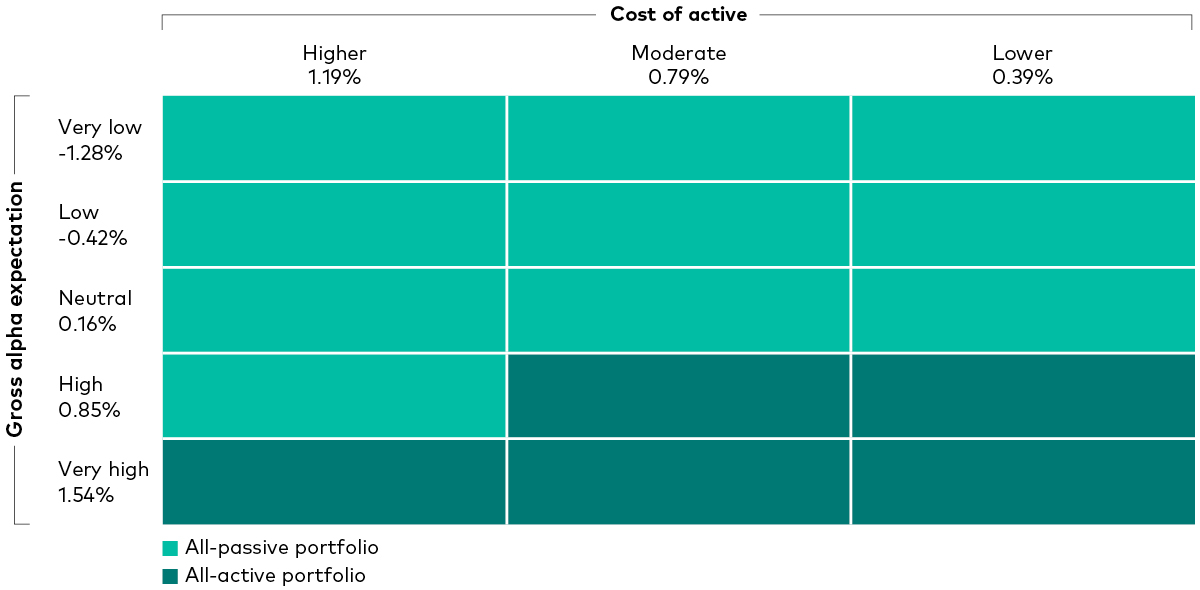
Further analysis shows how the approach can be applied in practice. When we run the two critical attributes of gross alpha expectation and cost through our model (with no consideration for active risk or active risk tolerance), we arrive at the results shown in the graphic below. It displays the outcomes of 15 scenarios ranging from the lowest gross alpha expectation and higher-cost active managers (the top left corner of the grid) to the highest gross alpha expectation and lower-cost active managers (the bottom right corner) and calculates the projected allocation ranges resulting from each set of circumstances.
Potential active/passive allocations based on two characteristics
Past performance is not a reliable indicator of future results.
Note: This hypothetical illustration does not represent any particular investment.
Source: Vanguard.
Two items are most striking. First, without a positive net alpha expectation an investor would be better off investing 100% in index funds. Second, without incorporating the impact of active risk and active risk tolerance, we are left with a binary choice of either 100% passive funds (when net alpha expectation is negative) or 100% active funds (when net alpha expectation is positive).
These simplified conditions result in no recommended active/passive mix but simply provide a measure of whether or not positive net alpha is expected. For example, the box at the intersection of high gross alpha expectation (0.85%) and moderate costs (0.79%) has a net alpha expectation of just 0.06% (0.85% minus 0.79%), yet the recommendation is all active funds.
An investor concerned about active risk might not allocate 100% to active funds in this instance but incorporate some portion of index funds to moderate risk.
When net alpha and risk considerations lead to a wider range of outcomes
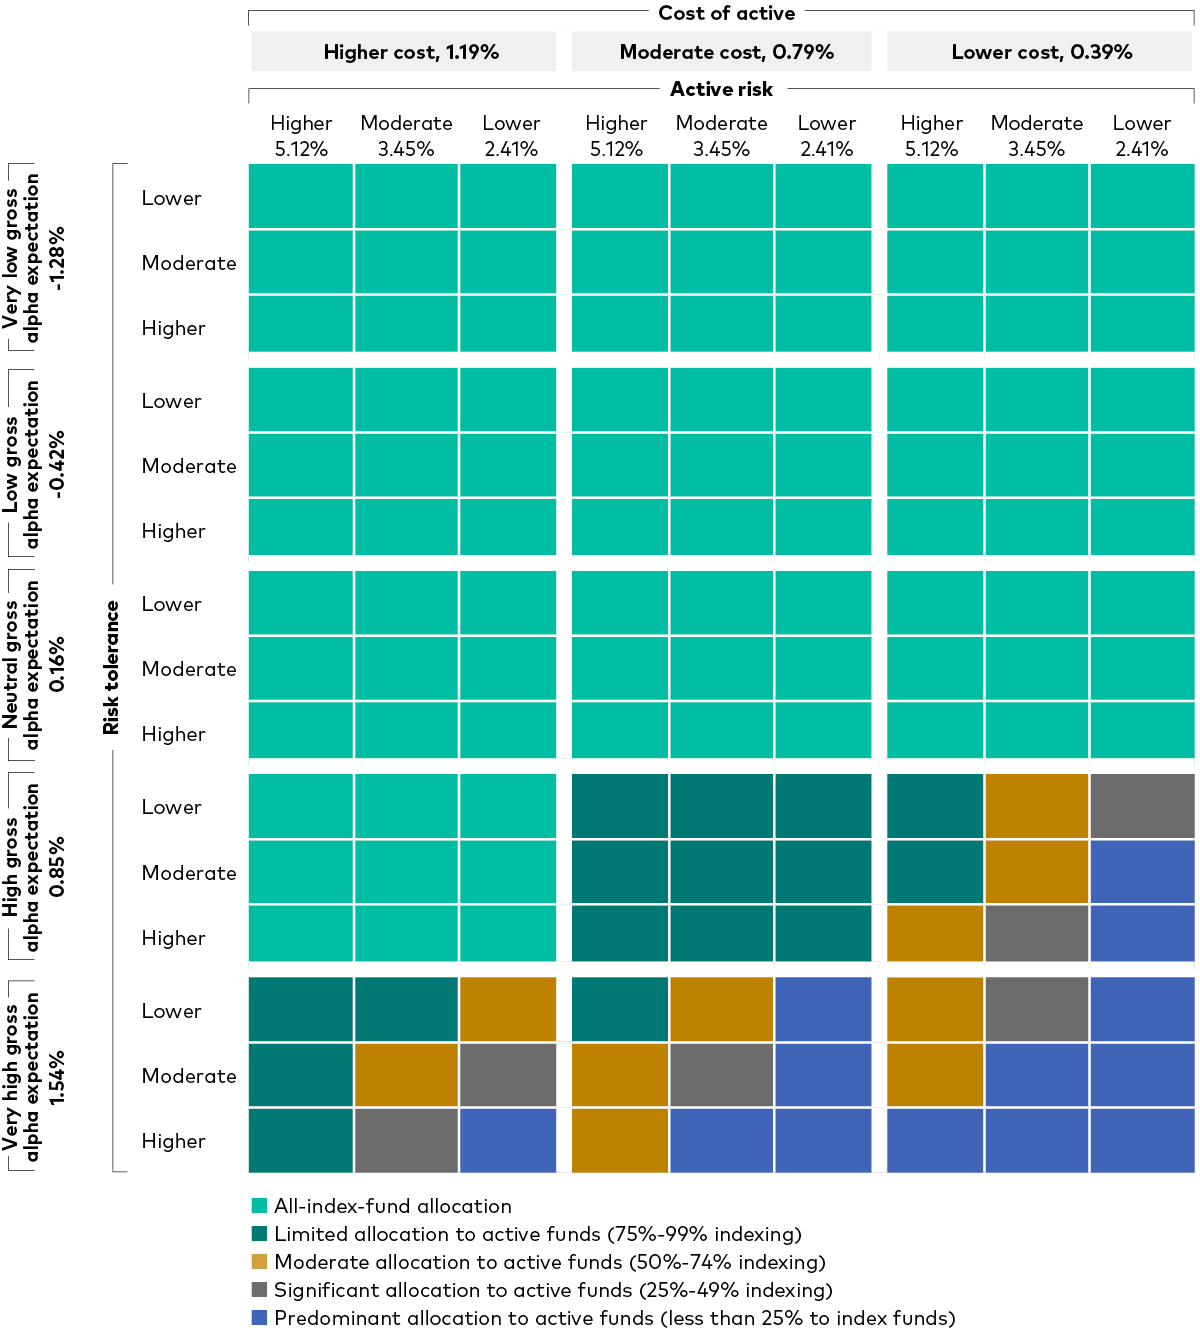
Combining the elements of active risk and active risk tolerance with gross alpha expectation and cost results in four variables, each with three different measurement levels. This is illustrated in the figure below.
Potential active/passive allocations based on four characteristics
Past performance is not a reliable indicator of future results.
Note: This hypothetical illustration does not represent any particular investment.
Source: Vanguard.
All the scenarios for investors with neutral (or worse) gross alpha expectations remain unchanged from the earlier analysis. If outperformance is the goal, cost, active risk level and active risk tolerance do not supersede the importance of identifying talent.
For those investors with high and very high gross alpha expectations (the expectation that they will select among the top two-thirds or one-third of all managers), indexing still makes up a sizeable portion of many allocations. Cost remains an influencing factor, as does aversion to active risk. But when higher assumptions for gross alpha are combined with lower assumptions for cost, active risk and active risk aversion, active allocations predominate.
This approach allows us to move from simple binary solutions of all-active or all-index investments to a more nuanced set of results that demonstrates the trade-off between net alpha expectations and tolerance for active risk. Furthermore, the quantitative nature of our framework discloses otherwise embedded assumptions and enables investors to assess a range of inputs.
Key takeaways
Indexing can be a valuable starting point for all investors. An allocation to active can also be a viable solution.
Advisers can use the active/passive framework to enable clients to think more deliberately about their expectations and the risks they’re willing to accept when it comes to their active/passive allocation.
Key questions to ask clients in determining the right allocation include what are their expectations of gross alpha, cost and manager risk? What is the client’s individual risk tolerance?
This is a summary of Making the Implicit Explicit: A Framework for the Active-Passive Decision by Daniel W Wallick, Brian R Wimmer, CFA, Christos Tasopoulos, James Balsamo, CFA and Joshua M Hirt, published in April 2017.
1 For a review of the empirical work done on the lack of systematic outperformance by investment type, see Davis, Joseph, Glenn Sheay, Yesim Tokat, and Nelson Wicas, 2007, Evaluating Small-Cap Active Funds, Valley Forge, Pa.: The Vanguard Group. For research regarding market periods’ lack of impact on active performance, see Philips, Christopher B., 2008, The Active-Passive Debate: Bear Market Performance, Valley Forge, Pa.: The Vanguard Group and Philips, Christopher B., Francis M. Kinniry Jr., and David J. Walker, 2014, The Active-Passive Debate: Market Cyclicality and Leadership Volatility, Valley Forge, Pa.: The Vanguard Group. For a discussion of what does affect active management success, see Wallick, Daniel W., Brian R. Wimmer, and James Balsamo, 2015, Keys to Improving Odds of Active Management Success, Valley Forge, Pa.: The Vanguard Group.
2 Sharpe, William F, 1991. The Arithmetic of Active Management. Financial Analysts Journal 47(1): 7–9.
3 See Wallick, Wimmer, and Balsamo (2015b) for further details.
4 For the purposes of this analysis we have assumed indexing is low-cost. Although not all index funds are low-cost, many market-cap-weighted index funds are. In addition, although active funds are, on average, higher-cost than the average index fund, not all active funds are high-cost, and so we consider a range of expense ratios.
5 Previous Vanguard research has discussed patience as one of the keys to successful use of active management. Active risk tolerance can also be thought of as how much patience an investor exhibits regarding fund volatility relative to the benchmark over time. See Wimmer, Chhabra, and Wallick (2013) for further discussion of successful active managers’ patterns of returns.
6 See Schlanger, Philips, and LaBarge (2012) for further discussion of this point.
7 This paper uses active risk as the key differentiating characteristic between fund strategies. History indicates that fund tracking errors have typically stayed within reasonable bands over time, thus providing a useful barometer for future expectations. Active share could also have been used to measure funds’ levels of relative risk, or ‘activeness’. Although tracking error and active share are different measures, Vanguard research indicates that they are quantitatively linked. We chose to use tracking error because better data are available and investors are more widely aware of how it’s calculated.

If you have completed all content in the module, you are ready to take the quiz and collect your CPD
Ready to test your knowledge?
Take the quizOther Vanguard 365 pillars
Practice management
CPD content designed to help you build your practice, market your services effectively and cultivate a thriving professional network.
Client relationships
CPD content crafted to empower you to service your client’s needs effectively, build relationships, create loyalty and achieve new business growth.
Financial planning
CPD content structured to give you access to useful tools, guides and multimedia resources covering diverse topics from risk profiling to retirement planning.
Investment risk information
The value of investments, and the income from them, may fall or rise and investors may get back less than they invested.
Important information
This article is designed for use by, and is directed only at persons resident in the UK.
The information contained in this article is not to be regarded as an offer to buy or sell or the solicitation of any offer to buy or sell securities in any jurisdiction where such an offer or solicitation is against the law, or to anyone to whom it is unlawful to make such an offer or solicitation, or if the person making the offer or solicitation is not qualified to do so. The information in this document does not constitute legal, tax, or investment advice. You must not, therefore, rely on the content of this article when making any investment decisions.
The information contained in this article is for educational purposes only and is not a recommendation or solicitation to buy or sell investments.
© 2025 Vanguard Asset Management, Limited. All rights reserved.
Vanguard Asset Management, Limited is authorised and regulated in the UK by the Financial Conduct Authority.