Investing in stocks and bonds is an essential part of any long-term investment strategy. Understanding the dynamics of these two asset classes and how they behave in relation to each other can help build effective long-term investment portfolios for clients.
In this article, we explore the fundamentals of the stock/bond return correlation and how changing economic conditions can influence the relationship. We’ll also discuss the role of global bonds in a multi-asset portfolio and the benefits of global diversification for long-term investors. With this knowledge, advisers can make informed decisions about client portfolios and ensure they are well-positioned to deliver value over the long term.
The risk and reward trade-off
The usefulness of traditional multi-asset portfolios of stocks and bonds, sometimes called the 60/40 model, hinges on investors accepting the trade-off between risk and reward, and appreciating the historical characteristics of different types of investment. Because while we can’t control what happens in markets, understanding the historical return patterns of equities and bonds can help manage risk in client portfolios.
The chart below shows the performance of global equities and global bonds over more than 20 years. One thing it clearly shows is the volatile nature of equity market returns, which stand in contrast against global bonds, which have historically delivered smoother, more predictable returns. Indeed, global bonds can help to reduce volatility in a portfolio – a key consideration for portfolio construction.
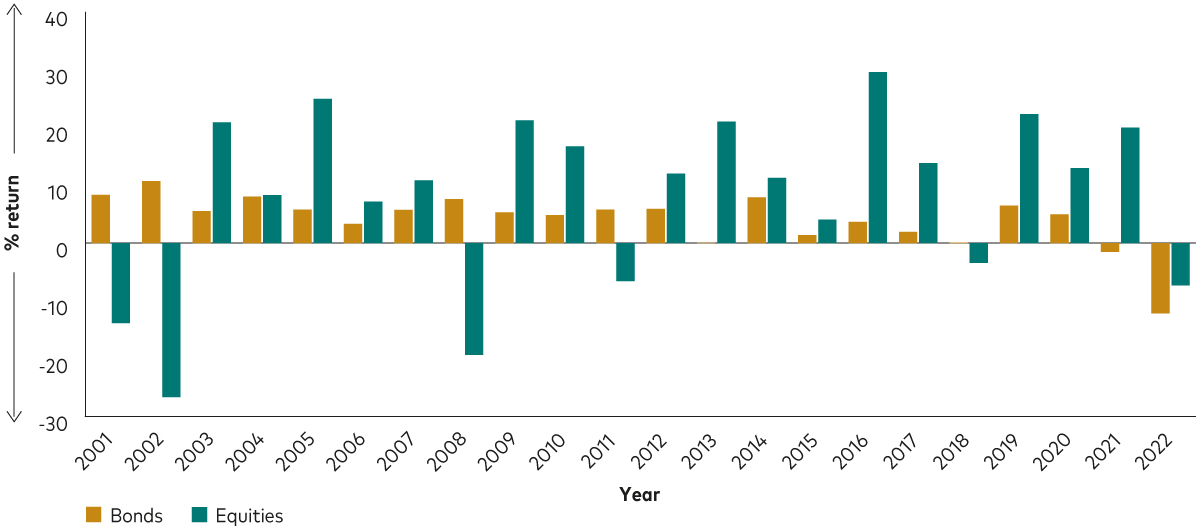
Past performance is not a reliable indicator of future returns.
Source: Vanguard calculations in GBP, based on data from Refinitiv. Data between 1 January 2022 and 5 April 2023.
Notes: The chart shows the historical annual total returns of the following indices: Bonds: Bloomberg Global Aggregate Total Return index (hedged in GBP); Equities: FTSE All-World Total Return index (in GBP). Data are for the period 29 December 2000 to 31 December 2022. The performance of an index is not the exact representation of any particular investment. As you cannot invest directly into an index, the performance shown in this chart does not include the costs of investing in the relevant index. Basis of performance NAV to NAV with gross income reinvested.
Perhaps the most important observation for long-term investors is the performance of global bonds in the years that equity market returns were negative. In the period covered in the chart, global bonds delivered a positive return in five of the six years that global equity markets posted losses, meaning an exposure to global bonds would have helped offset some of the losses inflicted by stock markets in those years.
Exploring the correlation between stock and bond market returns
The protection offered by global bonds during periods of equity market downturns is nothing new. The long-term return correlation between equities and bonds has been broadly negative since the 1990s, meaning the asset classes generally move in opposite directions. Understanding return correlations between asset classes is an important component of portfolio construction and the lower the correlation, the greater the diversification benefit. That diversification benefit applies to single securities, like between individual stocks and bonds, as well as across asset classes for multi-asset portfolios.
More precisely, correlation provides an estimate of how two variables, in this case the returns of equities and bonds, are linearly related. A negative return correlation means that, on average, when equity returns decrease, bond returns increase, and vice-versa. This inverse relationship between equity and bond returns has helped multi-asset portfolios weather various economic and market downturns.
A recent example of an exception to this inverse relationship was the simultaneous fall of both stock and bond markets in 2022 – illustrated on the right of the chart above. The scenario that came to pass in 2022 represented the first time that both equities and bonds had experienced negative returns in the same year since 19771. This unwelcome positive correlation was driven largely by a sharp, unexpected increase in interest rates - but the inverse relationship then resumed in 20232.
While the case of 2022 was rare, when we look at the stock/bond return correlation over shorter time frames, we can see that the correlation can enter positive territory from time to time. The next chart illustrates this, showing the rolling correlation of daily stock and bond returns over both 60-day and two-year periods between January 2002 and April 2023.
Over the two-year periods, the correlation has been negative for the past 20 years, but it is not uncommon for it to turn positive over shorter time frames.
Short and long-term stock and bond return correlation
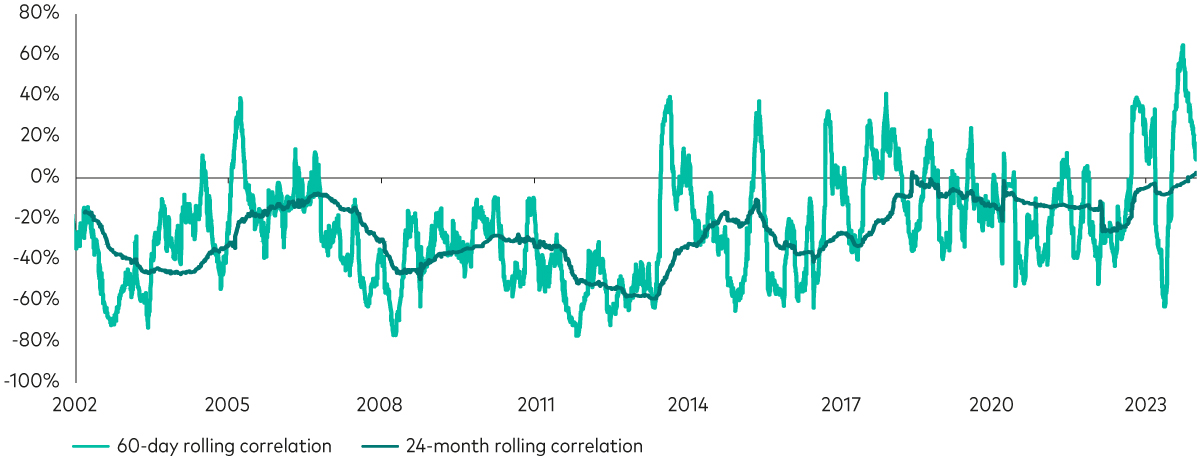
Past performance is not a reliable indicator of future results.
Notes: The chart shows the correlation of daily stock and bond returns over 60 business days and over 504 business days since 1 January 2002. Stocks are represented by the FTSE All-Share Total Return Index and bonds are represented by the Bloomberg Sterling Aggregate Bond Index. Data for the Bloomberg Sterling Aggregate Bond Index starts on 30 March 2000, which is why the line for the 24-month rolling correlation only starts on 6 March 2002. It is not uncommon for the correlation between stocks and bonds to turn positive over the shorter term, but this has not altered the longer-term negative relationship.
Source: Vanguard calculations in GBP, based on data from Refinitiv, as at 1 January 2024.
Occasional shifts into positive correlation territory are typically in response to economic shocks or surprises. More specifically, positive stock/bond correlations occur during supply-side economic shocks or when inflation exceeds central bank targets, prompting policymakers to adopt a more proactive monetary policy. The reason equity and bond returns are positively correlated under these circumstances requires an understanding of the two main variables that impact equity and bond prices: dividend cashflows and interest rates.
Expectation for higher dividends in the future boosts equity prices, so when the economy is growing, stock markets typically rise. Rising rates can be a headwind to stock markets since future company cashflows are discounted at a higher rate.
Interest rate movements also impact bond prices. An increase in interest-rates pushes the price of existing bonds down, while falling rates would typically see long-term bond prices rise. This repricing of bonds is based on the return an investor would receive if they held the bond to maturity (yield-to-maturity).
So, if we imagine a scenario whereby economic growth is positive and company cashflows are strong, we’d expect to see equity prices rise. At the same time, a buoyant economy typically encourages tighter monetary policy, meaning rising interest rates and therefore falling bond prices. Typically, in such a scenario, the net effect on stock markets from positive economic growth versus higher interest rates remains favourable and equity prices are expected to rise at a time that bond prices fall and, as such, the stock/bond return correlation is typically negative.
If there was a supply-side shock to the economy, caused by a geopolitical crisis or natural disaster, for example, we would expect to see policymakers taking a proactive approach to monetary policy to guide the economy through the shock. A recent example would be the two years that followed the Covid-19 pandemic, whereby supply chains saw unprecedented disruption globally and inflation soared, prompting the most aggressive interest rate-hiking programmes in recent history. That saw equity and bond prices fall simultaneously as investors anticipated tougher operating conditions for firms and the interest-rate outlook changed significantly.
The table below summarises the factors that can lead to a negative or positive return correlation between stocks and bonds.
The drivers of stock/bond return correlation
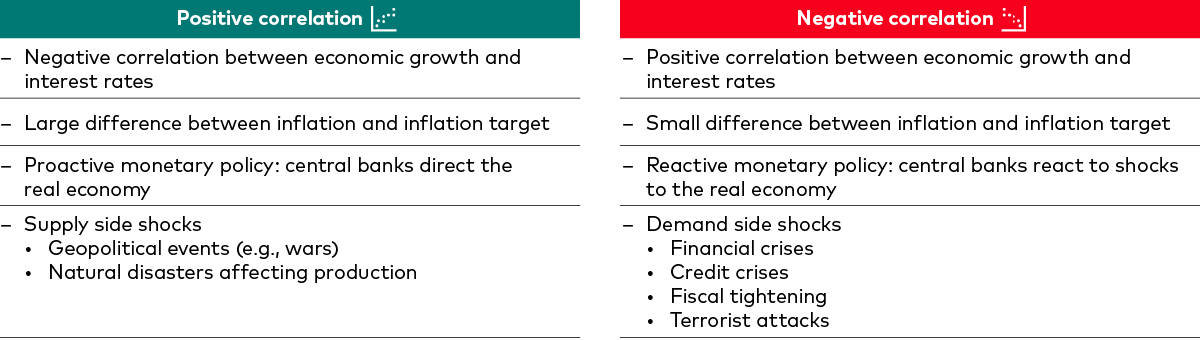
Source: Vanguard.
In recent times, the risk of persistently high inflation undermining traditional multi-asset strategies has been a concern for some investors. As the table states, a large gap between the inflation target and the rate of inflation can lead to a positive correlation, which is mainly due to the expectation that policymakers will keep rates high to bring inflation down.
Multi-asset portfolios and high inflation
Given the concerns about the 60/40 model in a high-inflation regime, we analysed the implications of persistently high inflation on traditional multi-asset portfolios. The chart below plots two efficient frontiers, i.e., the best possible return for the lowest possible risk for six different mixes of equities and bonds – from 100% bonds to 100% equities. The first efficient frontier — in brown — is constructed using the average correlation between equities and bonds from 2000 to 2021, which was equal to -7%. The 60/40 portfolio here has an expected return of 6.3% and a volatility of 9.4%.
Then, keeping all else equal, we constructed the same frontier but this time we assumed a much higher and positive return correlation of 33%, which was the average level of correlation between equities and bonds in the 1990s.
As the data shows, even in a positive correlation regime, a 60/40 investor would only need to shift their allocation marginally to 62% equities to achieve a similar outcome, with an annualised return of 6% and volatility of 10.1%.
Best risk/return frontiers under different global equity/bond correlation regimes
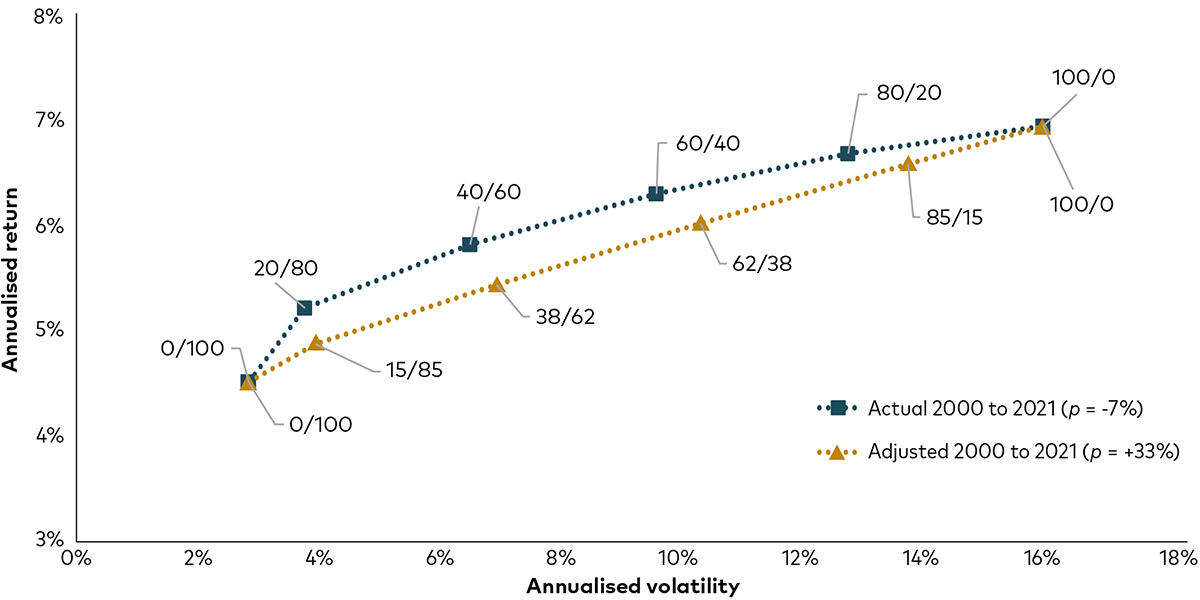
Past performance is not a reliable indicator of future results.
Source: Bloomberg. Notes: Data are monthly total returns in USD from 01 November 2000 to 31 December 2021. Global equities are represented by the MSCI ACWI Index. Global bonds are represented by the Bloomberg Global Aggregate Index Value (USD Hedged). For the period, the observed correlation between equities and bonds was -7%. The correlation coefficient of +33% was estimated using the same indices between 01 January 1990 and 31 December 1999.
While the entire efficient frontier in the positive correlation regime is lower relative to the efficient frontier in the negative correlation regime, meaning lower average returns, the change is probably less significant than most investors might expect.
The key message here is that correlation matters, but maybe not as much as most investors would believe; and that bonds’ diversification still works even when positively correlated to equities. The next chart illustrates this point further by focusing on the cumulative returns of global bonds and global equities during equity market downturns (defined as a fall of more than 10% from the previous maximum) and whether the monthly (i.e., short-term) stock/bond return correlation was positive or negative at the time of the downturn.
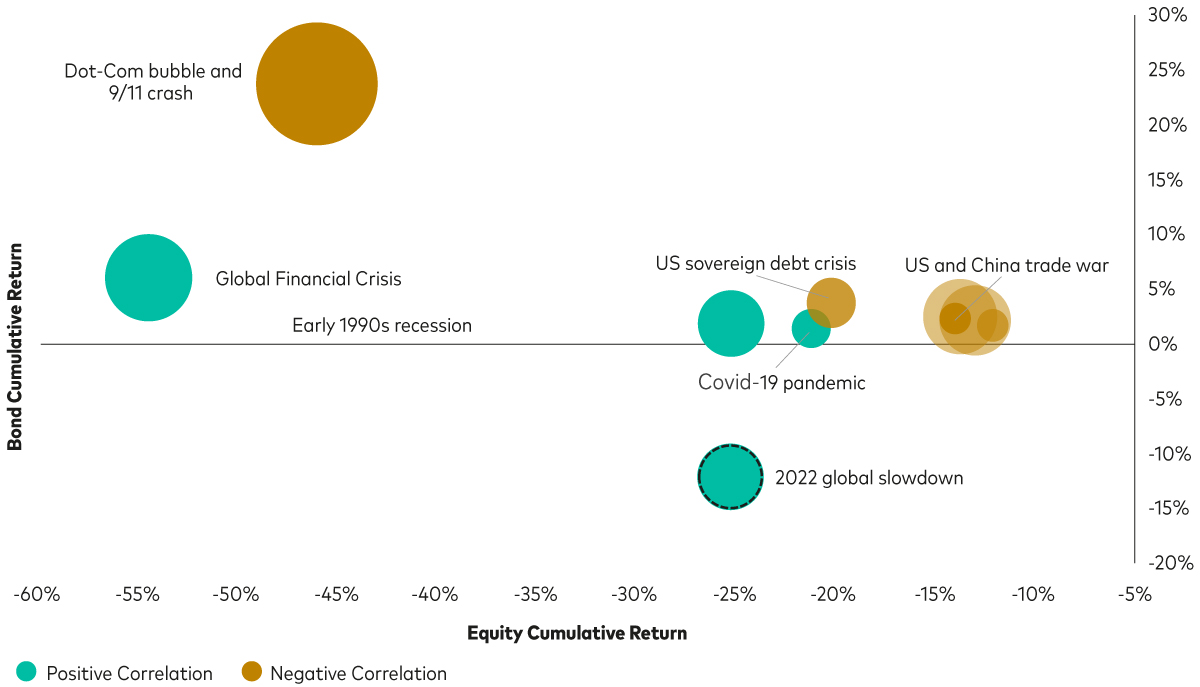
The size of each bubble is proportional to the number of calendar days that the period covers and the negative relationship between equities and bonds is clear. We can see how more severe global equity downturns have historically been accompanied by higher returns for bonds. For instance, during the 2007-08 global financial crisis, global equities declined by roughly 54% and during the same period, global bonds went up by more than 6%.
Also, the chart shows the average equity-bond correlation during these periods: the teal bubbles show equity downturns where the equity-bond correlation was positive, whereas the red bubbles represent a negative correlation.
Global equities and aggregate bonds performance during equity market downturns
Past performance is not a reliable indicator of future results.
Source: Bloomberg. Note: Data are monthly total returns in USD from 01 January 1990 to 30 April 2023. Global equities are represented by the MSCI ACWI Index. Global bonds are represented by the Bloomberg Global Aggregate Index Value (USD Hedged). An equity market downturn is defined as a decrease of more than 10% from the previous maximum. The size of each circle is directly proportional to the number of calendar days that the period covers. “Positive Correlation” refers to the equity downturn periods where the monthly correlation between global equities and global bonds was positive. Similarly, “Negative Correlation” refers to the equity downturn periods where the monthly correlation between global equities and global bonds was negative.
The message from this chart is clear: bar the exception of the 2022 global economic slowdown, even when the equity/bond correlation was positive, bonds have acted as shock absorbers during stock market downturns. As long as the return correlation between stocks and bonds is less than 1, investors can leverage the diversification benefits of holding the asset classes to construct portfolios with preferable risk-and-return characteristics.
Key takeaways
Understanding the negative long-term return correlation between equities and bonds can help investors build portfolios that deliver enduring value through various economic cycles.
Occasionally the stock/bond return correlation can turn positive over shorter time frames and the relationship is influenced by macroeconomic factors.
Persistently high inflation can lead to a sustained positive return correlation between equities and bonds, but the impact on 60/40-style portfolio returns is mitigated with a small tweak to asset allocation.
Even when stocks and bonds have been positively correlated, global bonds have acted as a shock absorber during equity market downturns.
1 Source: Bloomberg. Note: Annual total returns calculated in USD from 1977 to 2022. For equities, we use US equities represented by the MSCI USA Index from 1977 to 1987 and global equities afterwards, represented by the MSCI ACWI Index. For bonds, we use US bonds represented by the Bloomberg U.S. Aggregate Index from 1977 to 1990 and global bonds afterwards, represented by the Bloomberg Global Aggregate Index Value (USD Hedged).
2 Source: Vanguard calculations in GBP, based on data from Refinitiv. Data between 1 January 2022 and 5 April 2023. Stocks are represented by the FTSE All-Share Total Return Index and bonds are represented by the Bloomberg Sterling Aggregate Bond Index.

If you have completed all content in the module, you are ready to take the quiz and collect your CPD
Ready to test your knowledge?
Take the quizOther Vanguard 365 pillars
Client relationships
CPD content crafted to empower you to service your client’s needs effectively, build relationships, create loyalty and achieve new business growth.
Practice management
CPD content designed to help you build your practice, market your services effectively and cultivate a thriving professional network.
Financial planning
CPD content structured to give you access to useful tools, guides and multimedia resources covering diverse topics from risk profiling to retirement planning.
Investment risk information
The value of investments, and the income from them, may fall or rise and investors may get back less than they invested.
Important information
This article is directed at professional investors and should not be distributed to, or relied upon by retail investors.
This article is designed for use by, and is directed only at persons resident in the UK.
The information contained in this article is not to be regarded as an offer to buy or sell or the solicitation of any offer to buy or sell securities in any jurisdiction where such an offer or solicitation is against the law, or to anyone to whom it is unlawful to make such an offer or solicitation, or if the person making the offer or solicitation is not qualified to do so. The information in this article does not constitute legal, tax, or investment advice. You must not, therefore, rely on the content of this article when making any investment decisions.
The information contained in this article is for educational purposes only and is not a recommendation or solicitation to buy or sell investments.
Issued by Vanguard Asset Management, Limited which is authorised and regulated in the UK by the Financial Conduct Authority.
© 2024 Vanguard Asset Management, Limited. All rights reserved.