- Government bond yields fell in February, as intensifying global trade frictions and concerns about growth soured risk appetite.
- In the euro area, inflationary pressures and fiscal spending concerns initially led bond yields higher, before finishing the month at slightly lower levels.
- In credit markets, investment-grade spreads broadly widened over the month.
Multiple uncertainties combined to drive bond yields lower in February, as concerns around growth, inflation, policy and geopolitical tensions turned the mood decidedly risk-off over the course of the month.
In the US, rising global trade tensions and concerns about growth soured risk appetite.The 10-year US Treasury yield declined 33 basis points (bps)1 as markets anticipated the possibitility of future rate cuts to counter softening economic data. The risk-off sentiment carried over to the UK and euro area, although the decline in yields was less pronounced due to stronger macroeconomic data and increases in fiscal spending.
Germany’s incoming chancellor indicated his intentions to significantly increase Germany’s spending by over €100 billion. German 10-year bund yields rose in anticipation of the significant increase in government debt issuance needed to fund the plan, before retreating to finish at lower levels by month-end.
Inflation in developed markets remained above target levels. In the US, headline inflation ticked higher to 3%, and core inflation, which excludes volatile energy and food prices, rose to 3.3%. In the UK, headline inflation increased to 3% (a 10-month high) while core inflation rose to 3.7%, driven in part by the rising costs of private school fees, which have recently become subject to value-added tax (VAT). In the euro area, headline and core inflation fell to 2.4% and 2.6%, respectively, slightly above estimates.
At its February meeting, the Bank of England cut its base rate by 25 bps, to 4.50%, while signalling a gradual and careful approach to future rate cuts. The central bank continued to warn of the threat of stagflation, suggesting that slowing growth and faster inflation may lie ahead.
Monthly performance by market
| Global government bonds | Corporate bonds | Emerging market bonds | |||
| UK | Europe | US | HY | ||
| Bloomberg Global Aggregate Treasuries (USD Hedged) | Bloomberg Sterling Corporate Bond Index (USD Hedged) | Bloomberg Euro-Aggregate Corporates Index (USD Hedged) | Bloomberg Global Aggregate USD Corporate (USD Hedged) | Bloomberg Global High Yield Index (USD Hedged) | JP Morgan Emerging Markets Bond Index EMBI Global Diversified (USD Hedged) |
| 0.98% | 0.49% | 0.72% | 1.99% | 0.78% | 1.57% |
Past performance is no guarantee of future returns. The performance of an index is not an exact representation of any particular investment, as you cannot invest directly in an index.
Source: Bloomberg, for the period 31 January 2025 to 28 February 2025. Bloomberg indices are used as proxies for each exposure2.
Government bonds
Government bond yields broadly fell in February. In the US, two- and 10-year yields fell by 21 bps and 33 bps, respectively. In the euro area, German two-year bund yields fell by 9 bps and 10-year yields fell by 5 bps. In the UK, both two- and 10-year yields fell by 4 bps and 6 bps, respectively3.
Credit markets
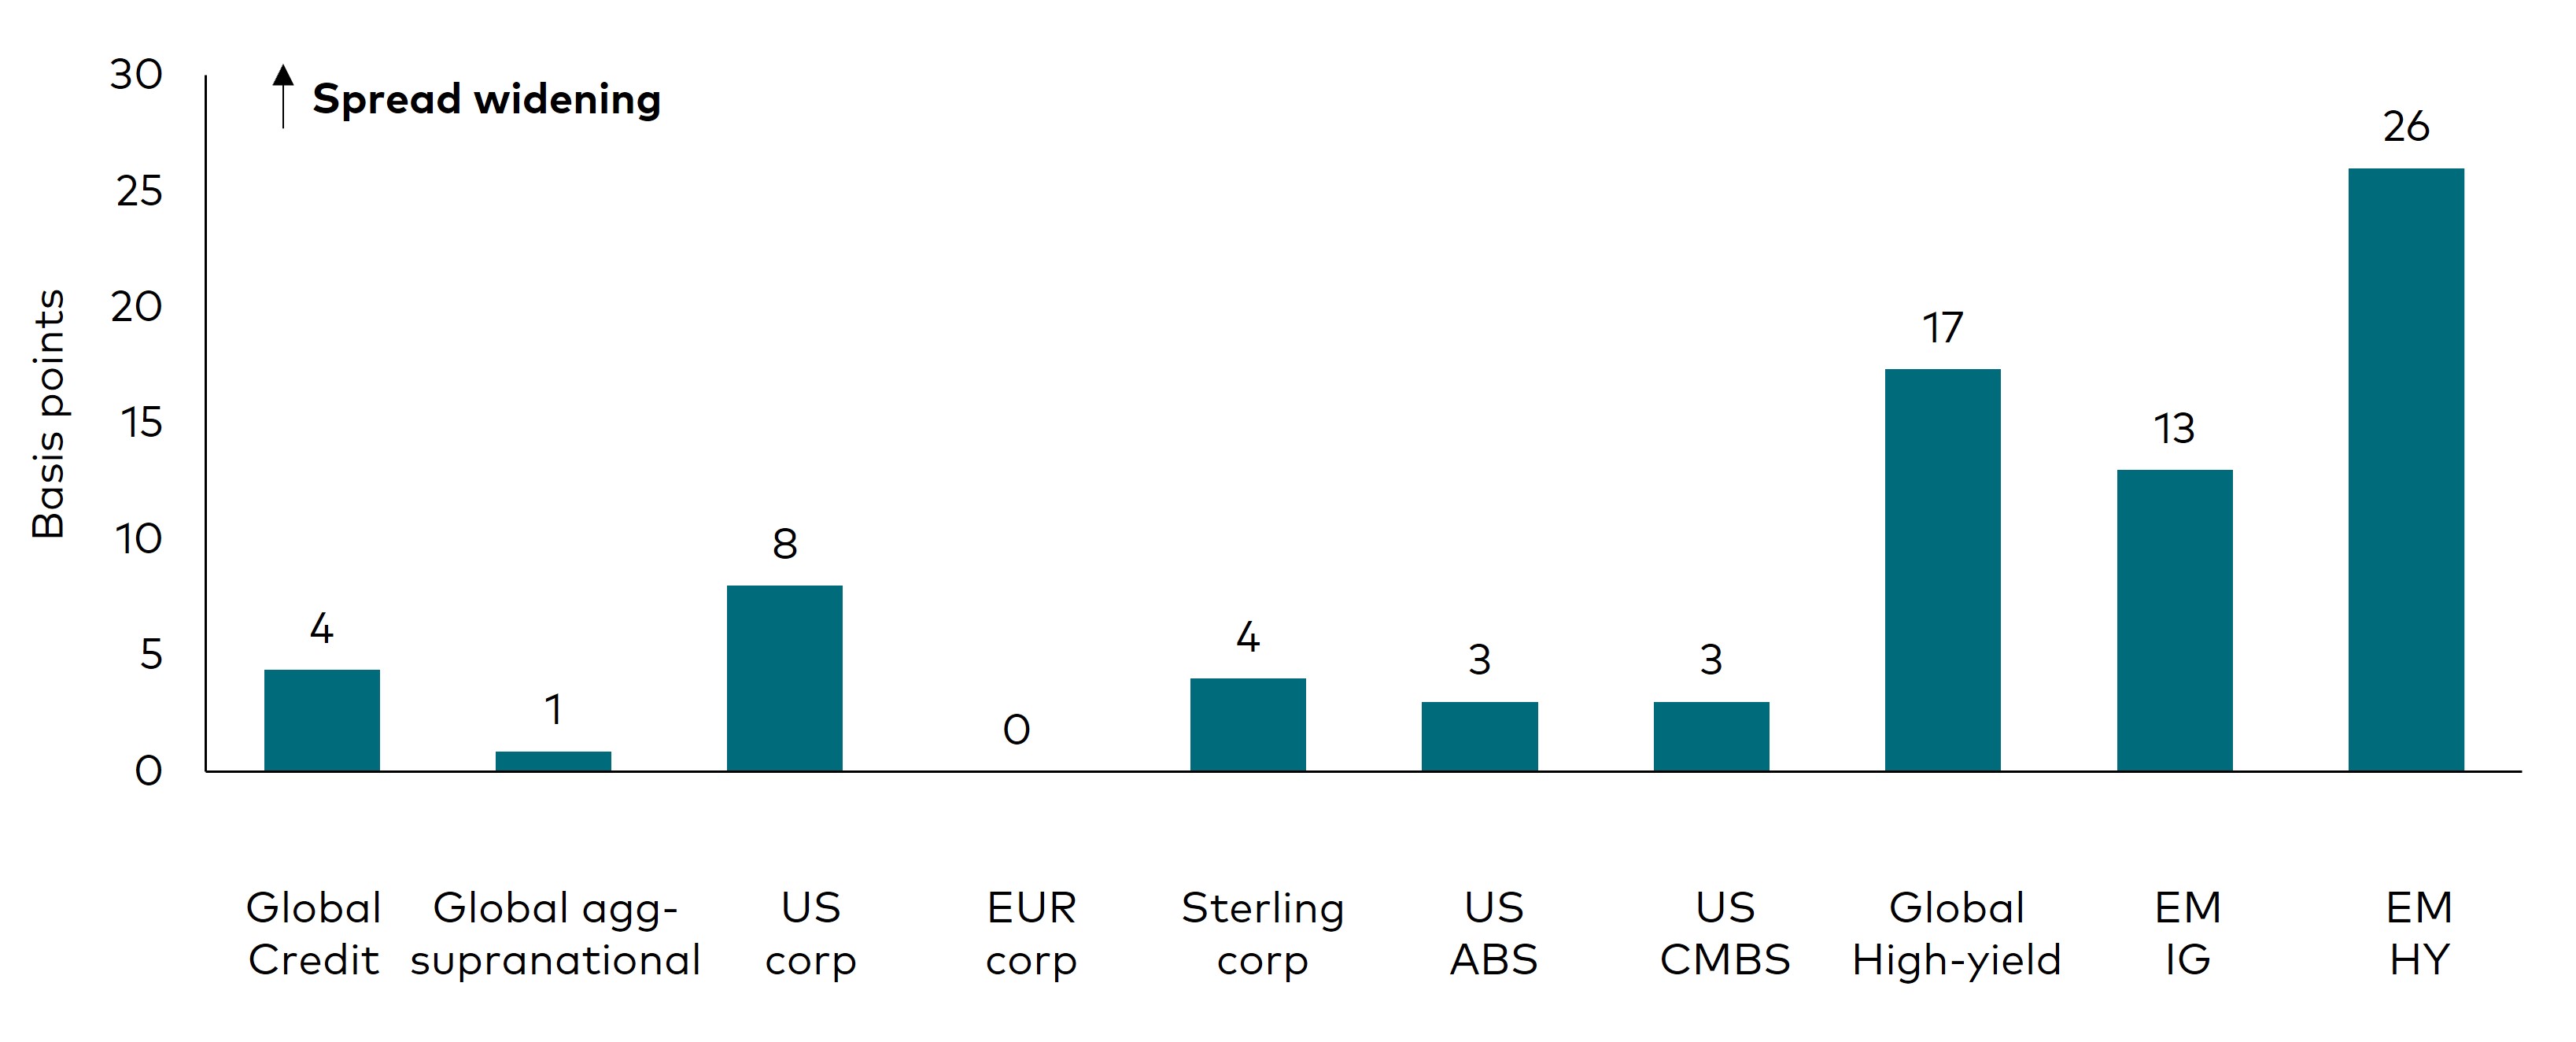
In corporate bond markets, investment-grade (IG) spreads broadly widened over the month, in line with the general risk-off sentiment in markets. US dollar- and sterling-denominated credit spreads widened by 8 bps and 4 bps, respectively, while euro-denominated spreads remained flat overall4. In emerging markets (EM), IG and high-yield (HY) spreads widened by 13 bps and 26 bps, respectively5.
Changes in spreads

Past performance is no guarantee of future returns. The performance of an index is not an exact representation of any particular investment, as you cannot invest directly in an index.
Source: Bloomberg. For the period 31 January 2025 to 28 February 2025. Proxies used for each exposure6.
Corporate earnings
Q4 2024 earnings season for European companies was in full swing in February. Positive earnings surprises from many companies (53% of reporting firms exceeded their earnings forecasts) led many analysts to raise their full-year 2025 expectations.
We remain of the view that, overall, European company fundamentals are in a good shape thanks to the de-leveraging undertaken over the past several years. Our base case remains that, over the coming quarters, revenue and earnings growth will pick up as easing monetary policy stimulates economic activity. However, geopolitical tensions and potential tariffs pose a downside risk to 2025 earnings.
The technical backdrop for European credit markets remains positive. Following a very strong 2024, the robust demand for credit continued in the first two months of 2025.
Emerging markets
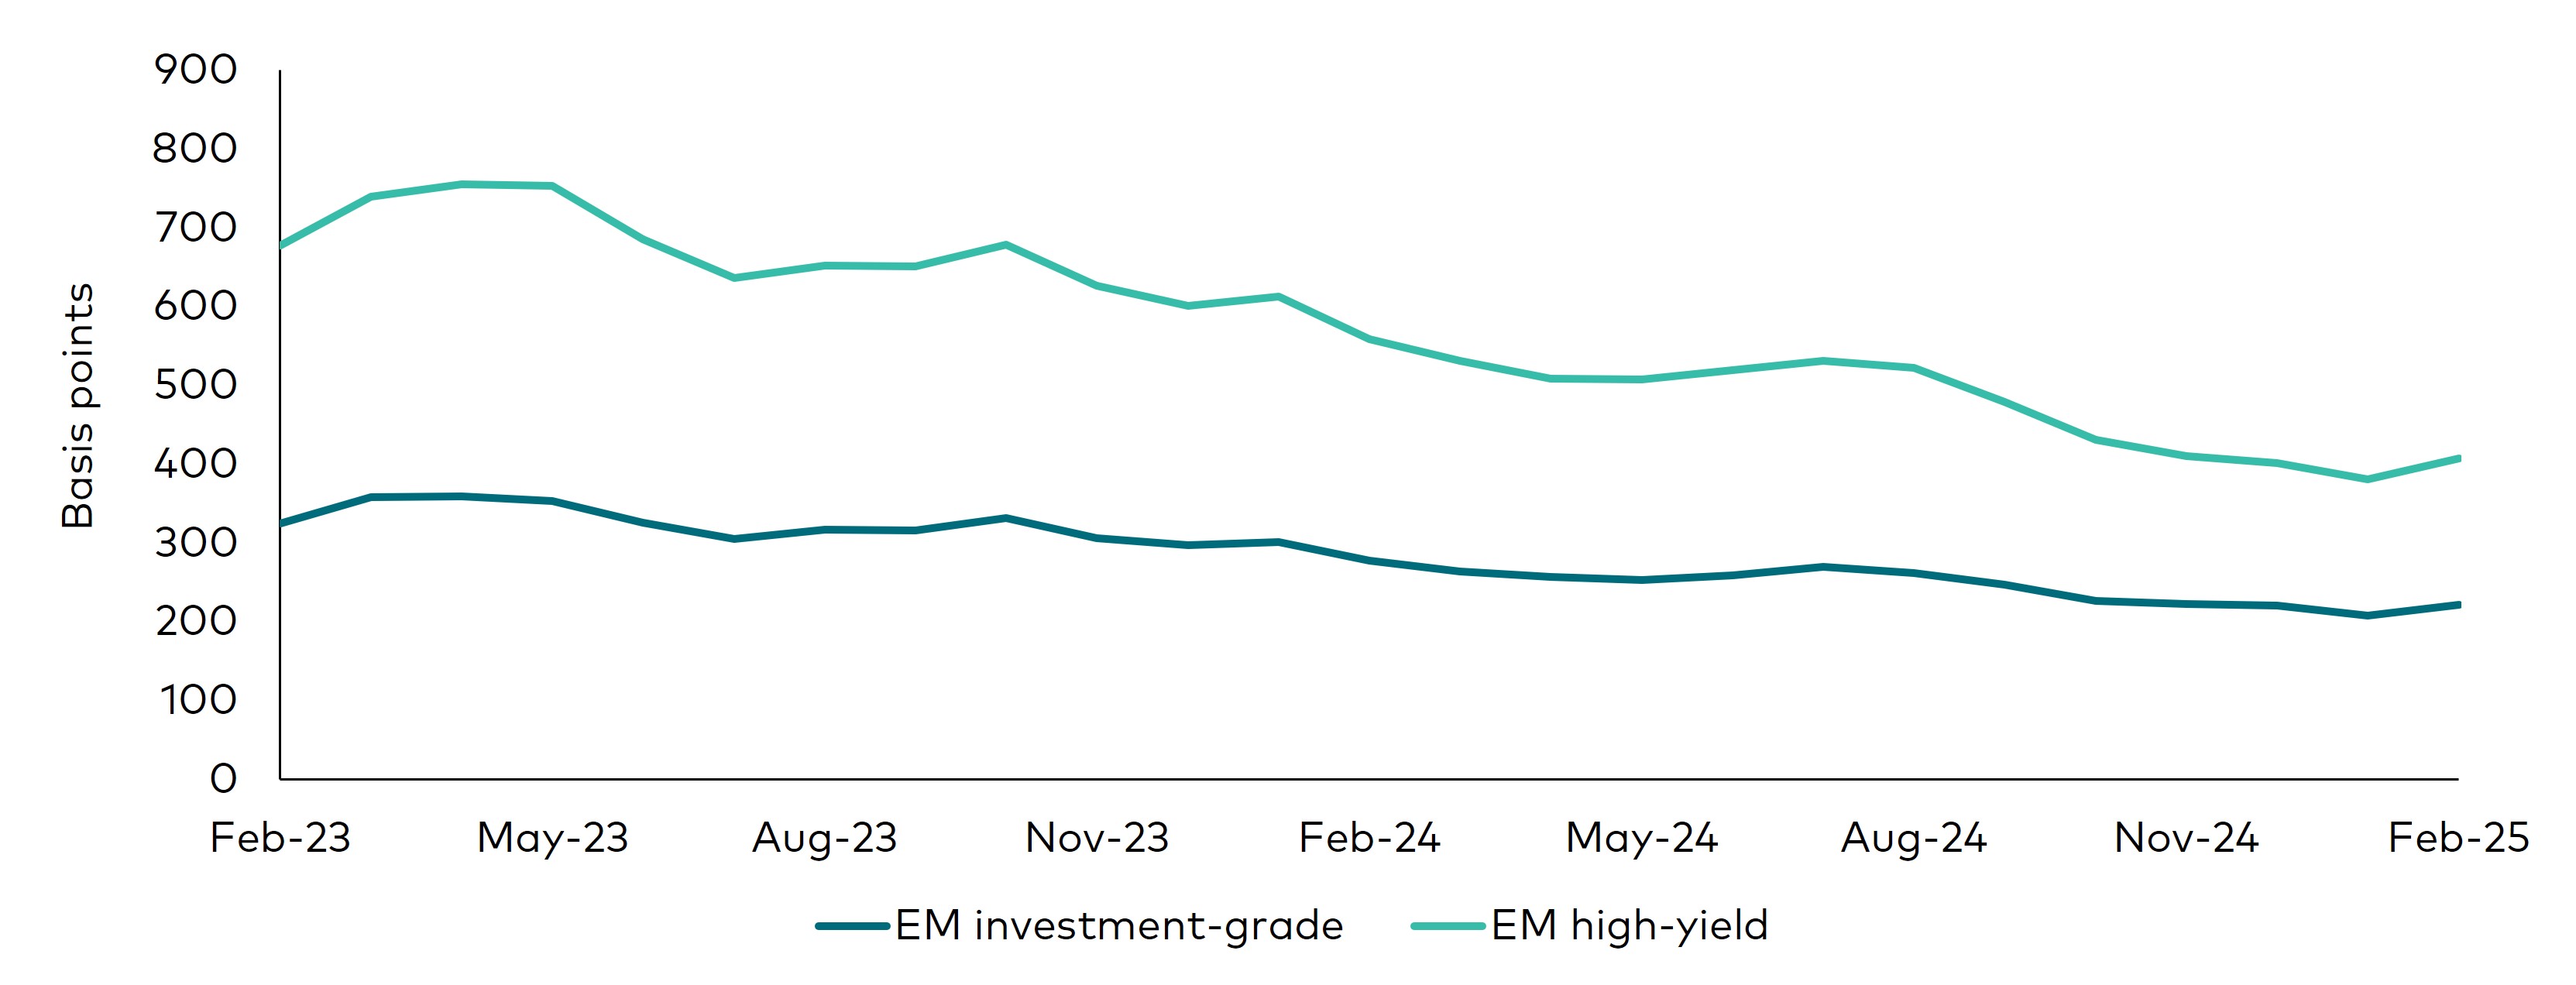
EM credit returned 1.6% in February, during which the asset class's sensitivity to falling US Treasury yields more than made up for the 12 bps of EM credit spread widening7. EM spreads moved wider across the quality spectrum. EM HY spreads widened by 21 bps as idiosyncratic stories in select countries such as Ecuador and Senegal compounded deteriorating global risk sentiment8. EM IG spreads finished the month 7 bps wider, driven by historically tight starting valuations coming into the year and heavy primary market supply9. EM IG net issuance totalled a multi-year high of $26.7 billion in February.
EM market credit spreads

Source: Bloomberg and Vanguard. For the 24 months to 28 February 2025. Proxies used: EM investment-grade: Bloomberg EM USD Aggregate Average OAS Index; EM high-yield: Bloomberg Emerging Markets High Yield Average OAS Index.
Outlook
We believe fixed income yields remain attractive and expect strong positive returns under most market environments.
In credit markets, IG spreads remain tight overall and consistent with a soft-landing economic narrative, although we have started to see US IG spreads widening in conjunction with rising risk-off sentiment. Despite lacklustrr growth in Europe, European IG spreads have continued to tighten and are almost in line with US IG spread levels. This is supported by robust fundamentals, positive earnings surprises and the anticipation of higher fiscal spending levels in key areas such as defence and infrastructure. Technicals remain strong, with robust demand for the asset class, while net supply in 2025 is expected to be flat or slightly lower. In HY credit markets, technicals remain strong, though are less favourable than in recent times. The skew of risks has changed, though in a recessionary outcome we would see lower-quality sectors more vulnerable, although yields at current levels are likely to offset any spread widening.
1 Source: Bloomberg and Vanguard, for the period 31 January 2025 to 28 February 2025.
2 Source: Bloomberg and Vanguard, based on the Bloomberg Global Aggregate Credit Index, for the period 31 January 2025 to 28 February 2025.
3 Source: Bloomberg and Vanguard, for the period 31 January 2025 to 28 February 2025.
4 Source: Bloomberg and Vanguard, based on the Bloomberg Global Aggregate Credit Index, for the period 31 January 2025 to 28 February 2025.
5 Source: Bloomberg and Vanguard, based on the Bloomberg EM USD Aggregate Average OAS Index and Bloomberg Emerging Markets High Yield Average OAS Index, for the period 31 January 2025 to 28 February 2025.
6 Bloomberg indices used as proxies for credit sector performance: Global Aggregate Credit Average OAS Index, Global Aggregate Supranational Index, US Aggregate Corporate Average OAS Index, Euro Aggregate Corporate Average OAS Index, Sterling Aggregate Corporate Average OAS Index, US Aggregate ABS Average OAS Index, US Aggregate CMBS Average OAS Index, Global High Yield Average OAS Index, JP Morgan EMBI Global Diversified IG Sovereign Spread Index, JP Morgan EMBI Global Diversified HY Sovereign Spread Index. Data for the period 31 January 2025 to 28 February 2025.
7 Source: Vanguard and JP Morgan, based on the J.P. Morgan Emerging Market Bond Index (EMBI) Global Diversified index, for the period 31 January 2025 to 28 February 2025.
8 Source: Bloomberg and Vanguard, based on the Bloomberg Emerging Markets USD Aggregate Average Option Adjusted Spread (OAS) Index and Bloomberg Emerging Markets High Yield Average OAS Index, for the period 31 January 2025 to 28 February 2025.
9 Source: Vanguard and JP Morgan, based on the J.P. Morgan Emerging Market Bond Index (EMBI) Global Diversified ndex relative to US Treasuries, for the period 31 January 2025 to 28 February 2025.
Our active bond funds managed in-house
Investment risk information
The value of investments, and the income from them, may fall or rise and investors may get back less than they invested.
Past performance is not a reliable indicator of future results. The performance data does not take account of the commissions and costs incurred in the issue and redemption of shares.
Important information
For professional investors only (as defined under the MiFID II Directive) investing for their own account (including management companies (fund of funds) and professional clients investing on behalf of their discretionary clients). In Switzerland for professional investors only. Not to be distributed to the public.
The information contained herein is not to be regarded as an offer to buy or sell or the solicitation of any offer to buy or sell securities in any jurisdiction where such an offer or solicitation is against the law, or to anyone to whom it is unlawful to make such an offer or solicitation, or if the person making the offer or solicitation is not qualified to do so. The information does not constitute legal, tax, or investment advice. You must not, therefore, rely on it when making any investment decisions.
The information contained herein is for educational purposes only and is not a recommendation or solicitation to buy or sell investments.
Issued in EEA by Vanguard Group (Ireland) Limited which is regulated in Ireland by the Central Bank of Ireland.
Issued in Switzerland by Vanguard Investments Switzerland GmbH.
Issued by Vanguard Asset Management, Limited which is authorised and regulated in the UK by the Financial Conduct Authority.
© 2025 Vanguard Group (Ireland) Limited. All rights reserved.
© 2025 Vanguard Investments Switzerland GmbH. All rights reserved.
© 2025 Vanguard Asset Management, Limited. All rights reserved.
