- Dividend payments accelerated globally in Q4 2024, despite a strong US dollar and macroeconomic headwinds.
- China, Japan and North America contributed the bulk of distribution growth in Q4, with dividends from companies in the financials, industrials, technology and consumer discretionary sectors underpinning that growth.
- Against this backdrop, we continue to see a case for broad exposure to dividends as a way to enhance total returns and diversify portfolios.
Companies shake off macro headwinds to propel Q4 dividend payouts
The final quarter of 2024 rounded off a stellar year for dividend distributions globally. Q4 distributions accelerated by 15% y/y to $438 billion, setting a new 12-month record of $2.2 trillion. Notably, global payouts withstood a number of macroeconomic headwinds, including China’s domestic economic challenges and the ongoing strength of the US dollar. As a result, the seasonally adjusted rate of expansion remained steady throughout the year, ending 2024 at a robust 8.5% higher y/y.
Q4 payout growth globally totalled $58 billion, of which China, Japan and North America contributed $42 billion, reflecting y/y growth of 100%, 24% and 9%, respectively. The industries underpinning that growth were financials, industrials, technology and consumer discretionary, contributing more than 70% of global payout growth in the period.
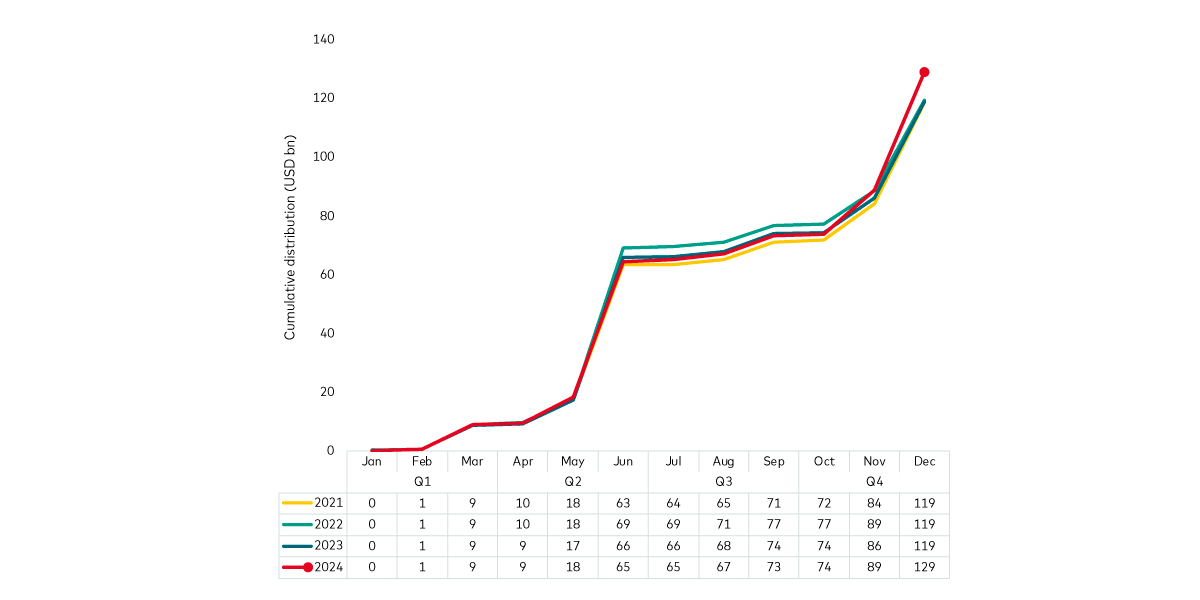
Japan’s payouts, which are overwhelmingly semi-annual and distributed mainly in Q2 and Q4, were relatively dominant in Q4 globally after seasonally high distributions by Europe and emerging markets in Q2 and Q3. Notwithstanding the negative currency translation effects of the yen’s devaluation in 2024, obscuring almost twice the dividend growth in local currency terms, distributions from Japanese firms in US dollar terms still rose by 8.4% y/y to $129 billion.
Japan exports propel payouts in Q4
Cumulative dividend distributions from Japanese firms show year-on-year growth

Past performance is not a reliable indicator of future returns.
Source: FactSet, Vanguard. Data as of 31 December 2024 and based on FTSE All-World Index constituents.
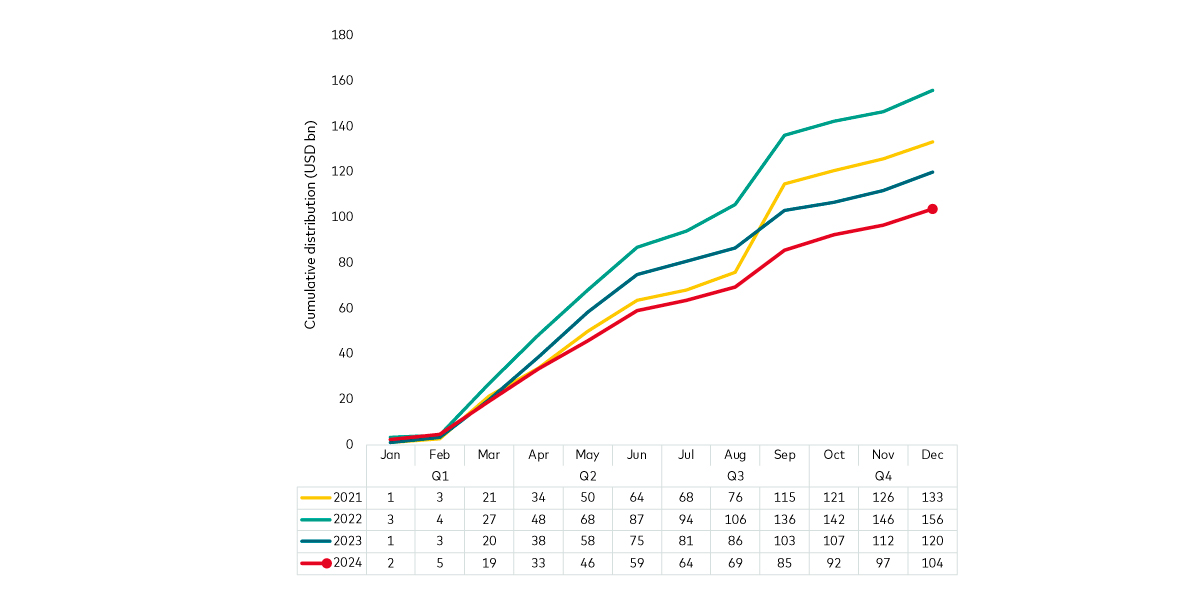
Basic materials globally faced major macro headwinds in 2024, including a prolonged real estate slump in China, which weakened demand for raw materials. The resulting drop in base metals prices, coupled with a further strengthening of the US dollar, impaired the profitability of many bellwether mining companies around the world and, for many of them, led to outright losses. Therefore, the slump in payouts in the period was broad-based, with the seasonally adjusted trend of distributions contracting 13% y/y.
Global basic materials payouts slumped in 2024
Macro headwinds have caused a broad-based drop in distributions

Past performance is not a reliable indicator of future returns.
Source: FactSet, Vanguard. Data as of 31 December 2024 and based on FTSE All-World Index constituents.
A look ahead
We expect US companies to deliver another strong showing in 2025, outpacing the distributions from firms in Europe, Asia Pacific and emerging markets in Q1 and in subsequent quarters. We look favourably towards technology’s mega-cap stocks, whose contribution to regular dividend distributions globally is still small but set to grow, as the likes of Meta and Alphabet initiated their first dividends in 2024. We would also highlight the regular distributions from some of the largest technology firms in the emerging markets that have established themselves as mature tech players.
The case for dividends
We previously laid out the case for investing in dividends given the market landscape. Importantly, following strong performance from growth equities, we believe investors may want to diversify their core beta holdings with dividend exposure. In addition, dividends can afford portfolios a buffer against inflation and recession risks, which could help in the face of uncertainty. Exposure to global dividends, in particular, can allow investors to counteract the seasonality of distributions while reducing the risk associated with relying on specific markets.
Related funds
Investment risk information
The value of investments, and the income from them, may fall or rise and investors may get back less than they invested.
Past performance is not a reliable indicator of future results.
Important information
For professional investors only (as defined under the MiFID II Directive) investing for their own account (including management companies (fund of funds) and professional clients investing on behalf of their discretionary clients). In Switzerland for professional investors only. Not to be distributed to the public.
The information contained herein is not to be regarded as an offer to buy or sell or the solicitation of any offer to buy or sell securities in any jurisdiction where such an offer or solicitation is against the law, or to anyone to whom it is unlawful to make such an offer or solicitation, or if the person making the offer or solicitation is not qualified to do so. The information does not constitute legal, tax, or investment advice. You must not, therefore, rely on it when making any investment decisions.
The information contained herein is for educational purposes only and is not a recommendation or solicitation to buy or sell investments.
Issued in EEA by Vanguard Group (Ireland) Limited which is regulated in Ireland by the Central Bank of Ireland.
Issued in Switzerland by Vanguard Investments Switzerland GmbH.
Issued by Vanguard Asset Management, Limited which is authorised and regulated in the UK by the Financial Conduct Authority.
© 2025 Vanguard Group (Ireland) Limited. All rights reserved.
© 2025 Vanguard Investments Switzerland GmbH. All rights reserved.
© 2025 Vanguard Asset Management, Limited. All rights reserved.
