- Multi-asset funds attracted net inflows in 2024, while equity peers saw net outflows for a third consecutive year.
- Within the multi-asset sector, low-cost funds recorded the vast majority of inflows.
- The trend towards multi-asset model portfolios solutions continued as assets under management rose for a fourth consecutive year.
Multi-asset funds were the most popular investment strategy among UK investors in 2024, with low-cost options driving the recovery of UK investment flows.
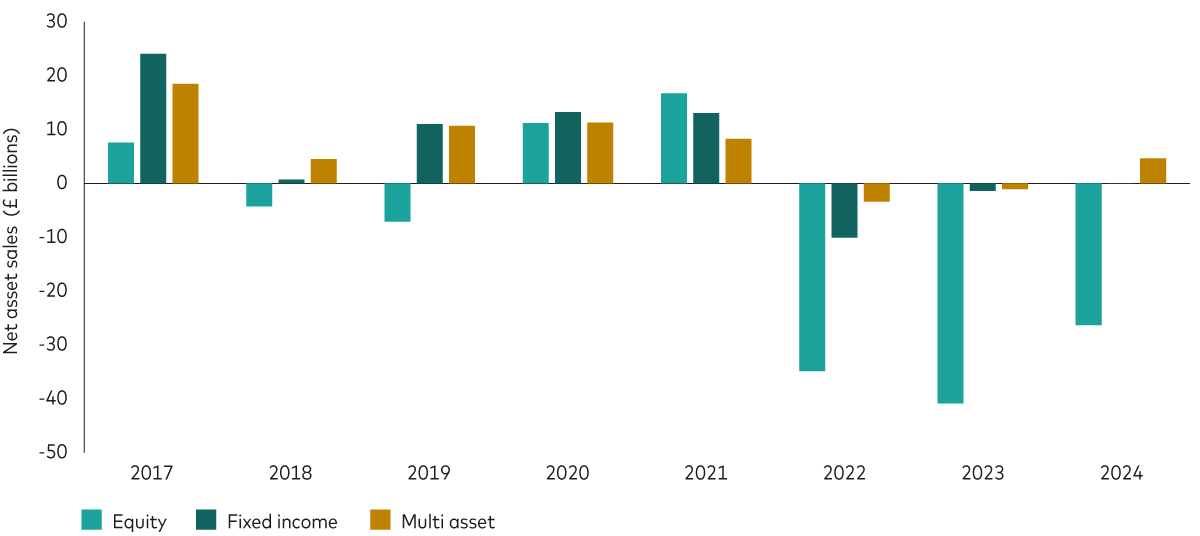
Data from the Investment Association (IA), illustrated in the chart below, show multi-asset funds achieved net inflows of £4.6 billion in 2024, while equity products recorded net outflows for the third consecutive year. Fixed income funds saw net inflows of £57 million in 2024 after two years of net outflows.
Multi-asset portfolios lead the way

Source: Investment Association EchoWeb as at 31 December 2024. Data from 1 January 2017 to 31 December 2024. Classification is based on Investment Association and referring to net sales in the UK. Note: Includes overseas funds, funds of funds, responsible investments funds and tracker funds and excludes feeder funds. Mixed Asset includes Flexible Investments, Mixed Investment 0-35% Shares, Mixed Investment 20-60% Shares, Mixed Investment 40-85% Shares. Currency in GBP.
The preference for all-in-one portfolios over single-asset funds could be explained by several factors. Stretched US equity valuations, heightened geopolitical uncertainty and an attractive long-term return outlook for global bond markets offer credible return-driven motives for the trend towards multi-asset solutions. That’s because multi-asset portfolios are designed to offer more balance than equity-only strategies by leveraging the negative long-term return correlation that exists between global equities and global bonds1. Falling rates on cash are another potential return driver.
Away from market-driven motives, there are practical reasons why financial advisers may be directing client capital towards multi-asset funds and model portfolios. By leveraging the expertise of an experienced investment manager through a multi-asset portfolio, advisers can spend more time on higher-value tasks, such as estate planning, spending strategies, tax optimisation and behavioural coaching, for example.
With an all-in-one solution, like Vanguard’s index-based LifeStrategy range and actively managed ActiveLife Climate Aware funds, investment managers typically provide regular performance updates, market insights and client-friendly conversation aids as part of the ongoing service. For clients with less complex investment needs, multi-asset funds and model portfolios can help advisers deliver value without spending excessive time on building and maintaining investment portfolios.
Low-cost and model portfolios attract flows
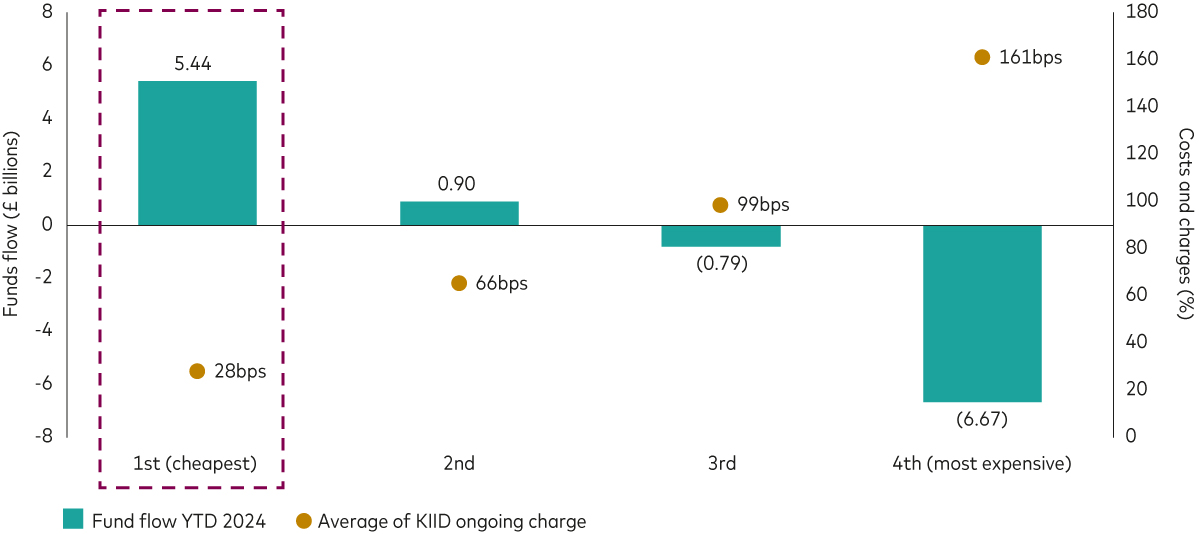
When we take a closer look at the flows within the multi-asset sector, this time using Morningstar data for greater granularity, we see a clear trend towards low-cost solutions. As the chart below shows, the cheapest quartile of multi-asset funds attracted net inflows of £5.44 billion last year. In contrast, the most expensive quartile of multi-asset funds saw net outflows of £6.67 billion.
Low-cost multi -asset has also been the clear winner

Source: Morningstar as at 30 November 2024. Data from 1 January 2024 to 30 November 2024. The ongoing charge is calculated based on the distribution of 796 products, divided into four quartiles. Each quartile, representing 25% of the total product counts, corresponds to different tiers of products based on pricing. Currency in GBP. BPS = basis points.
Keeping costs low has been one of Vanguard’s guiding principles for investment success since we opened for business in 1975. We strive to offer low-cost solutions in every market we enter because, if you look back at history, low-cost investments tend to outperform higher-cost peers over the long-term2. While you can’t control the markets or the economy, you can control your costs, and the data illustrated in the chart above suggest investors understand the importance of keeping costs low.
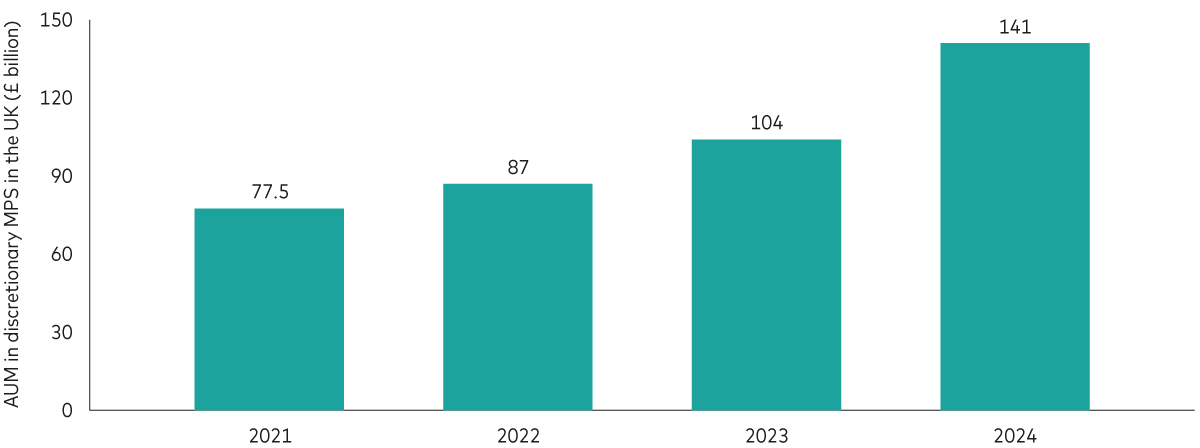
The UK average all-in cost for model portfolio solutions (MPS), which offer an alternative investment wrapper for multi-asset investors, fell for the fourth consecutive year in 2024 to 54 basis points (bps), down from 100 bps in 20213. The almost-halving of MPS fees may be an important driver behind their increasing popularity.
The next chart illustrates the growing assets under the management (AUM) of discretionary MPS managers in the UK, which inversely correlates with the fall in MPS fees, with MPS assets almost doubling between 2021 and 2024 (as fees almost halved).
AUM in discretionary MPS in the UK (£ billion)

Source: NextWealth MPS Proposition Comparison Report. Data bewteen 31 December 2021 and 31 December 2024.
All roads lead to multi-asset
The popularity of multi-asset funds and MPS is likely driven by a coalescence of factors that lead investors towards balanced investment strategies. Vanguard’s multi-asset funds and model portfolios employ a strategic asset allocation to global equities and global bonds to help investors manage risk, leaving only a simple choice between different equity and bond market exposures that support different investment goals and attitudes to risk.
Learn more about our suite of multi-asset funds and model portfolios, including index-based and active strategies.
Please visit our launch page to learn more about the new ETFs and how they can fit into portfolios. If you would like to learn more about Vanguard’s ETF offering more generally, we invite you to visit our capabilities page.
1 Vanguard analysis using data from Bloomberg. Data from 31 Dec 2003 to 29 Nov 2024. Global equities = MSCI ACWI Net Total Return Index. Global bonds = Bloomberg Global Aggregate Total Return Index Hedged GBP. Index performance and correlations are based on GBP total returns.
2 Vanguard calculations, using data from Morningstar, Inc. We considered all equity and fixed income funds available for sale in the UK from 1 January to 31 December 2023. Average annualised returns are calculated in GBP and net of expenses, excluding transaction costs and taxes.
3 Source: NextWealth MPS Proposition Comparison Report. Data bewteen 31 December 2021 and 31 December 2024. All-in costs include average MPS fee and average blended ongoing charges figure.
Build your knowledge and earn CPD
Discover tools, guides and multimedia resources. Built for (and with) financial advisers.
Events and webinars
Explore upcoming events and our on-demand library. All CPD accredited.
Investment risk information
The value of investments, and the income from them, may fall or rise and investors may get back less than they invested.
Important information
This is directed at professional investors and should not be distributed to, or relied upon by retail investors.
For further information on the fund's investment policies and risks, please refer to the prospectus of the UCITS and to the KIID before making any final investment decisions. The KIID for this fund is available, alongside the prospectus via Vanguard’s website.
For further information on the investment policies and risks of the model portfolio(s), please refer to the prospectus and KIID of the underlying funds before making any final investment decisions. The KIID for each fund is available, alongside the prospectus via Vanguard’s website.
This is designed for use by, and is directed only at persons resident in the UK.
The information contained herein is not to be regarded as an offer to buy or sell or the solicitation of any offer to buy or sell securities in any jurisdiction where such an offer or solicitation is against the law, or to anyone to whom it is unlawful to make such an offer or solicitation, or if the person making the offer or solicitation is not qualified to do so. The information is general in nature and does not constitute legal, tax, or investment advice.
Potential investors are urged to consult their professional advisers on the implications of making an investment in, holding or disposing of shares and /or units of, and the receipt of distribution from any investment.
The Authorised Corporate Director for Vanguard LifeStrategy Funds ICVC is Vanguard Investments UK, Limited. Vanguard Asset Management, Limited is a distributor of Vanguard LifeStrategy Funds ICVC.
The Manager of the Ireland domiciled funds may determine to terminate any arrangements made for marketing the shares in one or more jurisdictions in accordance with the UCITS Directive, as may be amended from time-to-time.
For investors in UK domiciled funds, a summary of investor rights can be obtained and is available in English.
For investors in Ireland domiciled funds, a summary of investor rights can be obtained and is available in English, German, French, Spanish, Dutch and Italian.
Issued by Vanguard Asset Management Limited, which is authorised and regulated in the UK by the Financial Conduct Authority.
© 2025 Vanguard Asset Management Limited. All rights reserved.
