Imagine a client has come into some money – perhaps from an inheritance, bonus or asset sale. Is the best course of action to invest it as a lump sum, or drip feed it into the markets over time (known as cost averaging)?
Cost averaging is often touted as a good way of smoothing out the peaks and troughs of investment markets, but unequivocal evidence supports the case for lump-sum investing.
Getting clients’ money to work faster means that lump-sum investment strategies beat cost-averaging approaches more than two-thirds of the time1.
Let’s take a closer look at the evidence, as well as at certain cases where cost averaging may still be the preferred route.
The evidence
Having compared the performance of cost averaging (CA) and lump-sum (LS) investing across various markets over rolling one-year periods between 1976 and 2022, Vanguard Research found that a lump-sum approach won between 61.6% and 73.7% of the time.
The longer the time it took to fully invest the capital, the higher the ‘hit ratio’ of the lump-sum strategy.
Evidence for lump-sum investing beating cost averaging
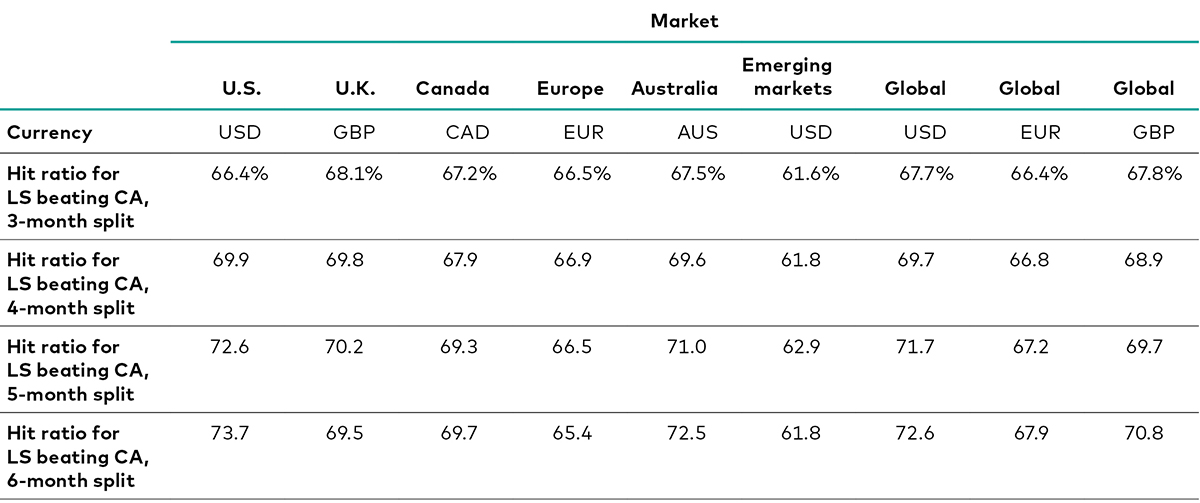
Notes: Hit ratio is defined as the outperformance of one strategy against the other after a one-year investment period. One-year rolling investment performance compares LS against CA. Our base case for CA is the three-month split, meaning splitting the investment into three equal parts and investing each one month apart. Data are based on: for the US, the Russell 3000 Index, 1979–2022; for the UK, the FTSE All-Share Index, 1986–2022; for Canada, the S&P/TSX Composite Index, 1985–2022; for Europe, the MSCI Europe Index, 1998–2022; for Australia, the S&P/ASX 300, 1992–2022; for emerging markets, the MSCI Emerging Markets Index, 1988–2022; and for global returns, the MSCI World Index, 1976–2022 (for USD and GBP) and 1998–2022 (for EUR).
Source: Vanguard.
The results are explained by the opportunity cost of delaying fully investing the capital: the longer it takes, the greater the cost.
There is also a clear relationship between asset allocation and the outperformance of a lump-sum strategy: the higher a client’s equity allocation, the greater the margin of outperformance.
Using the MSCI World Index and Bloomberg U.S. Aggregate Bond Index as proxies for equity and bond markets for the period 1976 to 2022, and looking at median returns for a one-year rolling investment timeframe, a 100% equity portfolio was 2.2% higher if invested as a lump sum as opposed to cost averaged over three months. A 60/40 portfolio invested as a lump sum led to an average ending value of 1.8% more, while a 40/60 equity/bond split generated 1.2% more.
The relationship represents the opportunity cost of lost risk premium. The months spent partly in cash represent lost risk premium, and the potential risk premium is greater in more heavily equity-weighted portfolios.
In fact, the lump-sum strategy outperforms in all but the worst outcomes – even at the 25th percentile of outcomes, lump-sum investing beats cost averaging. In the 5th percentile, it is the cost-average strategy that gains more – by 3.6%, 1.4% and 0.6% for 100% equity, 60/40 and 40/60 asset allocations, respectively.
The flipside of this is that in the very best outcomes (the 95th percentile), the lump-sum strategy extends its lead – to as much as 6.4% for the 100% equity portfolio. The 60/40 lump-sum portfolio is 4.6% ahead of the cost-averaging approach, while the 40/60 portfolio is 3.7% ahead.
Although the calculations in the table below are in US dollars, we would expect to see a similar pattern in other currencies given the hit ratios shown earlier.
Historical wealth ranges for lump-sum investing versus cost averaging after a one-year investment period
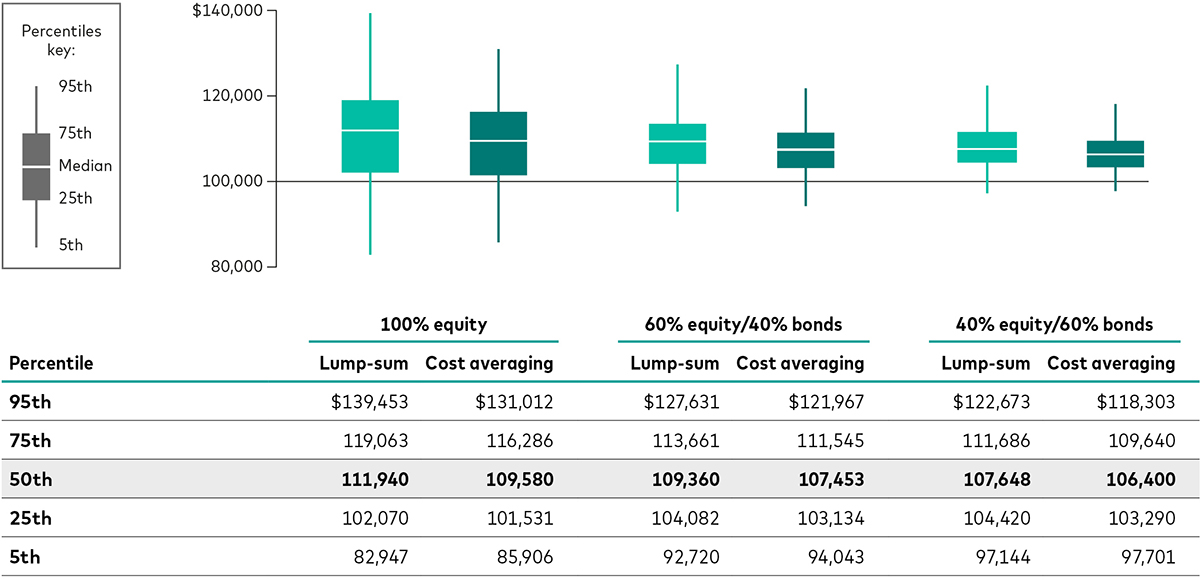
Notes: This figure is for illustrative purposes only and does not represent any particular investment. Percentiles are for a one-year rolling investment period with a starting wealth of $100,000 for each of three portfolios (100% equity, 60% equity/40% bonds, and 40% equity/60% bonds) using a lump-sum strategy versus a three-month cost-averaging split (splitting a lump sum into three equal parts and investing each one a month apart). Calculations are made using MSCI World Index and Bloomberg U.S. Aggregate Bond Index returns for 1976–2022.
Source: Vanguard.
Lump-sum approach has wider distribution of outcomes
Although studying the extreme scenarios is helpful, our recommendation to use lump-sum investing is based on the more likely scenarios between the 25th and 75th percentiles, where the lump-sum approach outperforms cost averaging.
The charts below show that the lump-sum approach has a wider distribution, namely a higher 95th percentile and a lower 5th percentile than that of cost averaging. The gap between portfolio values is particularly wide in the early months of the extreme upside and downside scenarios.
A cost-averaging approach can safeguard against losses in extreme down markets – however, it also hinders portfolio growth in all other markets. The relationship between increased return at the cost of additional risk-taking suggests that investors with higher loss aversion would be better off drip feeding their investment through a cost-averaging approach.
Lump-sum investing yields a higher median return with additional risk

Notes: LS = lump sum, CS = cost averaging. This figure is for illustrative purposes only and does not represent any particular investment. The graphs show the differences in investment outcomes after a one-year investment period for both lump-sum and cost averaging approaches using simulated return paths. LS outperforms CA at the median, and the probability of LS outperformance is similar to the historical analysis presented in this paper. Starting at a portfolio value of $100,000, after a one-year investment, the three-month CA strategy yields $504 less than the LS strategy, and the six-month CA strategy yields $1,491 less than the LS strategy.
Source: Vanguard.
Of course, there may be some scenarios where, despite the likelihood of lower returns, a cost-average strategy is the better option. For those investors with an aversion to loss, there can be value in taking the slower path to portfolio growth if it helps to minimise big drawdowns2.
In seeking to quantify a loss-averse investor’s preference for the lower-risk cost- averaging strategy, Vanguard Research constructed a utility model with loss aversion and compared utility between cost averaging and lump-sum strategies in terms of their ‘certainty equivalent’ (the return that an investor will accept today in lieu of a higher but uncertain return in the future – in other words, for a given utility function, a utility-maximising investor would expect the same level of utility from investing in the risky portfolio and investing in the riskless asset)3.
The model incorporates both risk aversion (a preference for more certain outcomes) and loss aversion (a penalty on negative outcomes). Looking at several investor personas with varying levels of risk and loss aversion, we found that the investor with loss aversion favours cost averaging, while the investor without loss aversion prefers a lump-sum strategy.
However, even for investors with high loss aversion who find cost averaging more palatable than lump-sum investing, the opportunity cost should be minimised by investing the capital over a short period, such as three months.
For investors with high risk and loss aversion cost-averaging might be more suitable
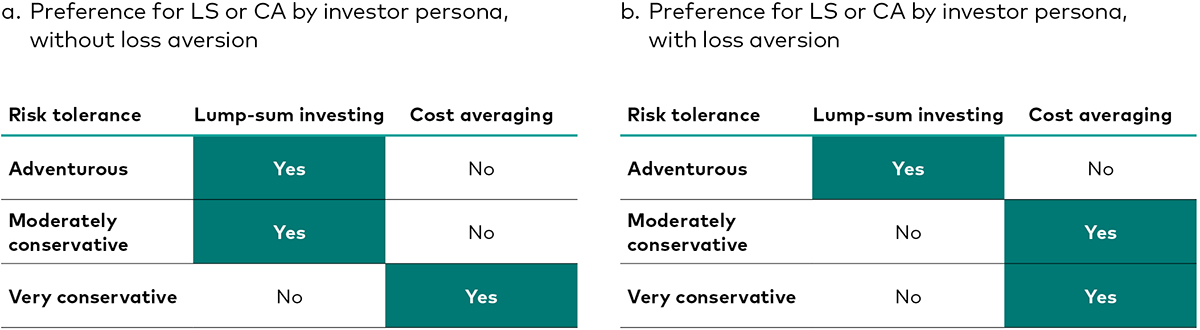
Notes: LS - lump sum, CS - cost averaging. The assumed risk aversion levels are 3 for adventurous, 6 for moderately conservative, and 10 for very conservative. There is no loss aversion penalty. Strategy preference is assigned to the higher certainty equivalent return. The certainty equivalent return for the adventurous persona is 1.0603 for LS and 1.0559 for CA. For the moderately conservative persona, it is 1.0443 for LS and 1.0421 for CA. For the very conservative persona, it is 1.0232 for LS and 1.0237 for CA.
Source: Vanguard.
Putting the evidence into practice
The findings form a useful basis for discussions with clients. The evidence overwhelmingly supports the case for lump-sum investing for most investors, bar the most loss averse.
It’s important to bear in mind that this relates only to instances whereby a client has a lump sum available for investment and should not be confused with making regular monthly investments from income, which are an important part of promoting good saving and investment discipline.
However, even for those clients who do not receive a windfall, there are actionable ways to put the evidence into practice, such as by investing as much as possible in tax-advantaged vehicles as early each tax year as possible.
Another instance when investors have to decide between cost averaging and lump-sum approaches is when making regular withdrawals from a pension during retirement. Here, one could make the reverse cost-averaging argument for withdrawals. In other words, taking out a lump sum at the start of the year rather than withdrawing each month might not be the optimal approach for clients. However, having a lump-sum amount ready for the whole year can add some security in the event of market downturns.
Ultimately, deciding between the two strategies boils down to opportunity cost, loss and risk tolerance and client preferences.
Key takeaways
Lump-sum investing beats cost averaging about two-thirds of the time.
Because of opportunity cost of lost risk premium, the longer the cost-averaging period, the greater the underperformance relative to lump-sum approaches.
The higher the equity allocation, the greater the margin of outperformance of lump-sum investing relative to cost averaging.
Cost averaging outperforms in the very worst downside scenarios.
The best strategy for each client depends on opportunity cost, risk and loss aversion and investor preferences.
1 ‘Cost averaging: Invest now or temporarily hold your cash?’, Vanguard Research, Megan Finlay and Josef Zorn, February 2023.
2 This behavioural concept is well-documented. See, more generally, Tversky and Kahneman (1992) or, in connection with cost averaging, Statman (1995).
3 A certainty equivalent, or certainty equivalent return (CER), is the riskless level of return that would result in the same utility score an investor would expect from a risky investment.

If you have completed all content in the module, you are ready to take the quiz and collect your CPD
Ready to test your knowledge?
Take the quizOther Vanguard 365 pillars
Client relationships
CPD content crafted to empower you to service your clients' needs effectively, build relationships, create loyalty and achieve new business growth.
Practice management
CPD content designed to help you build your practice, market your services effectively and cultivate a thriving professional network.
Investment knowledge
CPD content formulated for you to explore in-depth insights on investment principles, portfolio construction and comprehensive product education to expand your technical knowledge.
Investment risk information
The value of investments, and the income from them, may fall or rise and investors may get back less than they invested.
Important information
This article is designed for use by, and is directed only at persons resident in the UK.
The information contained in this article is not to be regarded as an offer to buy or sell or the solicitation of any offer to buy or sell securities in any jurisdiction where such an offer or solicitation is against the law, or to anyone to whom it is unlawful to make such an offer or solicitation, or if the person making the offer or solicitation is not qualified to do so. The information in this document does not constitute legal, tax, or investment advice. You must not, therefore, rely on the content of this article when making any investment decisions.
The information contained in this article is for educational purposes only and is not a recommendation or solicitation to buy or sell investments.
© 2025 Vanguard Asset Management, Limited. All rights reserved.
Vanguard Asset Management, Limited is authorised and regulated in the UK by the Financial Conduct Authority.