Index investing, by which we mean a passive, broadly diversified, market-capitalisation-weighted strategy, was first made widely available to US investors by Vanguard’s Jack Bogle with the launch of the first indexed mutual fund in 1976. Since then, low-cost index investing has proven to be a successful investment strategy, outperforming most active managers across markets and asset styles1.
In part because of this long-term outperformance, index investing has seen exponential growth among investors, particularly since the global financial crisis of 2007-09. In recent years, governmental regulatory changes, the introduction of indexed ETFs and a growing awareness of the benefits of low-cost investing in multiple world markets have made index investing a global trend.
This article reviews the conceptual and theoretical underpinnings of index investing’s ascendancy and discusses why we expect it to continue its success and popularity.
Zero-sum game theory
The central concept underlying the case for index-fund investing is that of the zero-sum game. This theory states that, at any given time, the market consists of the cumulative holdings of all investors, and that the aggregate market return is equal to the asset-weighted return of all market participants. Since the market return represents the average return of all investors, for each position that outperforms the market, there must be a position that underperforms the market by the same amount, as illustrated by a bell curve as seen below. In aggregate, the excess return of all invested assets equals zero.
Market participants' asset-weighted returns from a bell curve around market's return
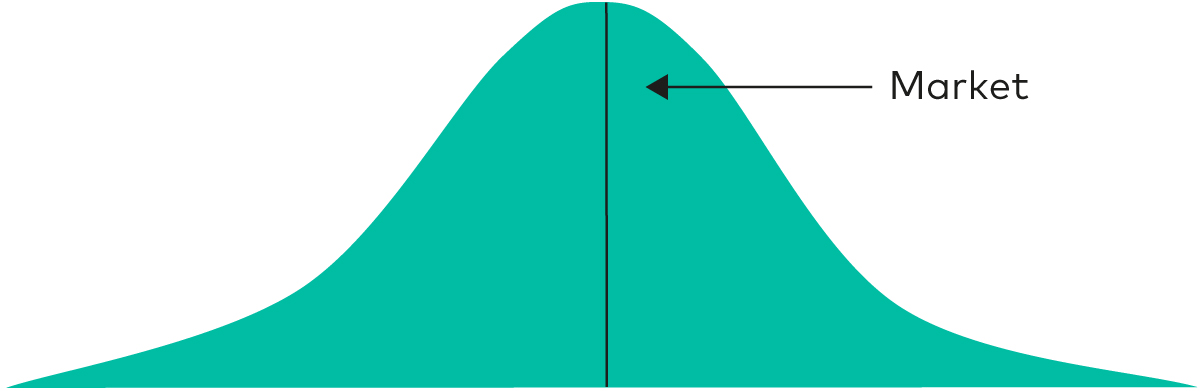
Source: Vanguard.
This concept does not depend on any degree of market efficiency and applies to all markets – those thought to be less efficient, such as small-cap and emerging market equities, and those widely regarded as efficient, such as large caps in developed markets. It may seem counterintuitive that the zero-sum game would apply in inefficient markets. By definition, an inefficient market will have more price and informational inefficiencies and, therefore, more opportunities for outperformance. Although this may be true to an extent, for every profitable trade an investor makes, another investor must take the opposite side of that trade and incur an equal loss. This holds true regardless of whether the security in question is mispriced or not. For the same reason, the zero-sum game must apply regardless of market direction, including bear markets, where active management is often thought to have an advantage. In a bear market, if a manager is selling out of an investment to position the portfolio more defensively, another or others must take the other side of that trade, and the zero-sum game applies.
Effect of costs
Some investors may still find active management appealing, as it seemingly would provide an even-odds chance of successfully outperforming. However, the costs of investing, particularly in higher-cost active funds, can make outperforming the market significantly more difficult than the gross-return distribution would imply.
The zero-sum game describes a theoretical cost-free market and excludes management fees, bid-ask spreads, administrative costs, commissions, market impact and taxes, which added together can be significant and reduce investors’ net returns over time. The aggregate result of these costs shifts the return distribution to the left of the market return bell curve.
The figure below shows two different investments compared to the market. The first investment is an investment with low costs, represented by the red line. The second investment is a high-cost investment, represented by the green line. Although both investments move the return curve to the left – meaning fewer assets outperform – the high-cost investment moves the return curve much further to the left, making outperformance relative to both the market and the low-cost investment much less likely. In other words, after accounting for costs, the aggregate performance of investors is less than zero sum, and as costs increase, the performance deficit becomes larger.
Market participant returns after adjusting for cost
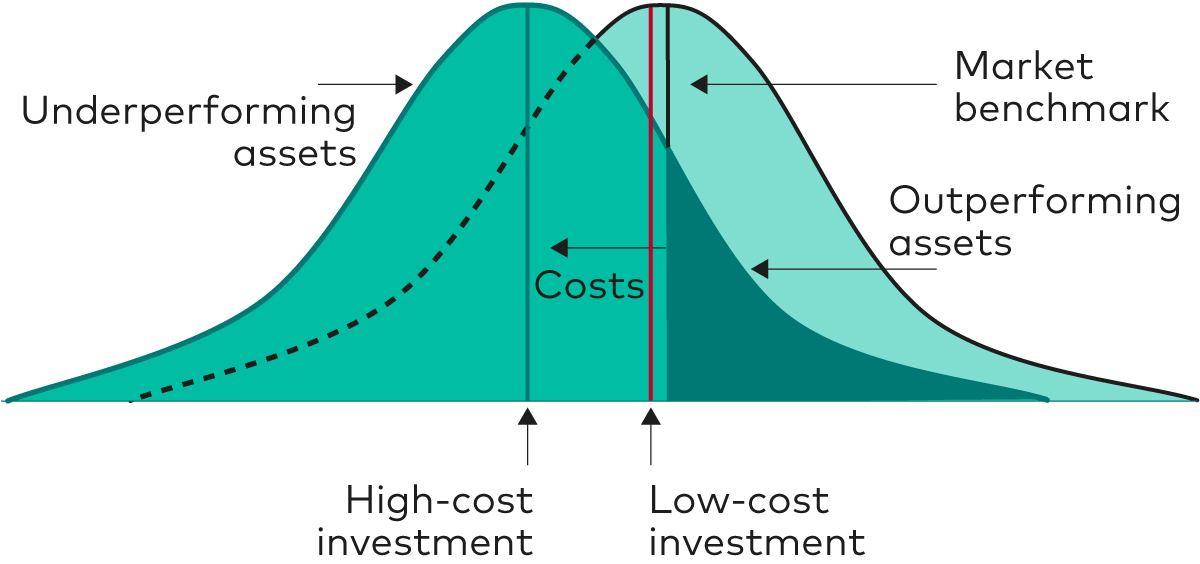
Source: Vanguard.
This performance deficit also changes the risk-return calculus of those seeking to outperform the market. As costs increase, both the odds and magnitude of underperformance increase until significant underperformance becomes as likely as, or more likely than, even minor outperformance.
The following figure illustrates the zero-sum game on an after-cost basis by showing the distribution of excess returns of domestic equity funds (chart a) and fixed income funds (chart b) net of fees. For both asset classes, a significant number of funds’ returns lie to the left of the prospectus benchmark, which represents zero excess returns. Once merged and liquidated funds are considered, a clear majority of funds fail to outperform their benchmarks, meaning that negative excess returns tend to be more common than positive excess returns.
Distribution of equity and fixed income funds' excess return
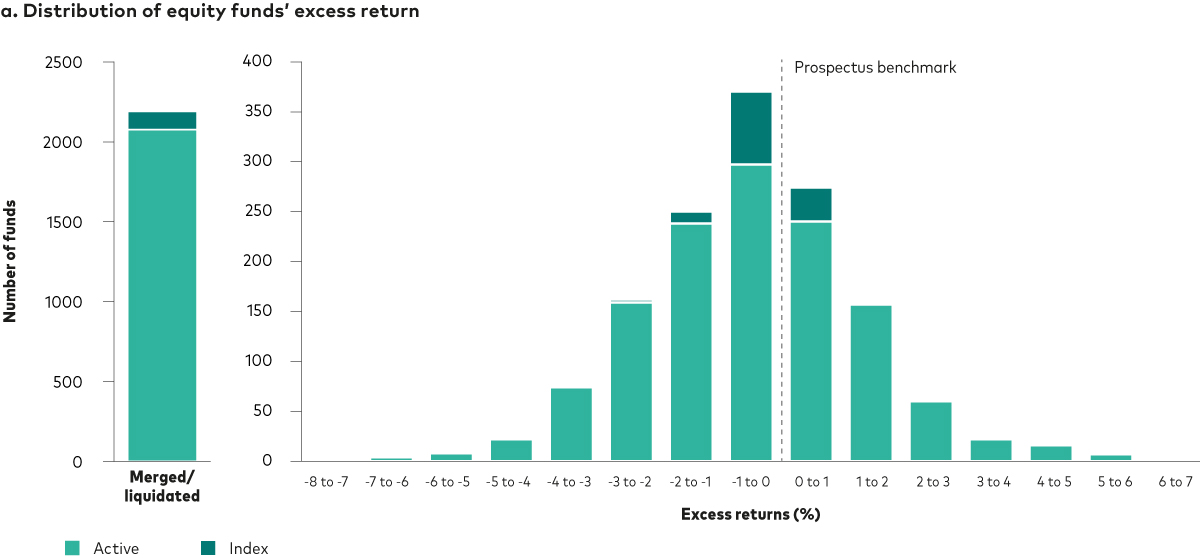
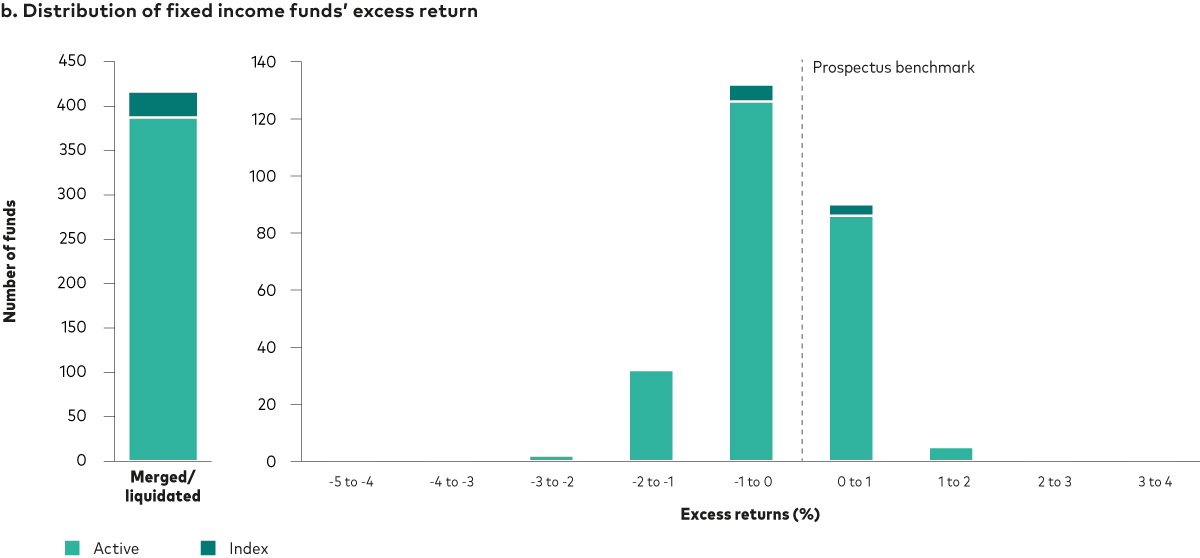
Past performance is no guarantee of future results.
Notes: Charts a. and b. display distribution of equity and bond mutual funds’ and ETFs’ excess returns relative to their prospectus benchmarks for the 15 years to 31 December 2022. NAV-based performance; returns calculated in GBP, net of fees with income reinvested. Only funds available for sale in the UK are included. Please refer to the Appendix for a list of fund categories considered.
Sources: Vanguard calculations, based on data from Morningstar, Inc.
This negative correlation between costs and excess return is not unique to active managers. Research into index funds and ETFs, looking at several variables including expense ratio, turnover, tracking error, assets under management, weighting methodology and active share, found that expense ratio was the most dominant variable in explaining an index fund’s excess return2.
To quantify the impact of costs on net returns, we charted managers’ excess returns as a function of their expense ratios across various categories of equity and fixed income funds over a ten-year period. The results show that higher expense ratios are generally associated with lower excess returns3. For investors, the clear implication is that by focusing on low-cost funds (both active and passive), the probability of outperforming higher-cost portfolios increases.
Persistent outperformance is scarce
For those investors pursuing an actively managed strategy, the critical question becomes: which fund will outperform? Most investors approach this question by selecting a winner from the past. Investors cannot profit from a manager’s past success, however, so it is important to ask: does a winning manager’s past performance persist into the future? Academics have long studied whether past performance can accurately predict future performance. About 50 years ago, Sharpe (1966) and Jensen (1968) found limited to no persistence. Three decades later, Carhart (1997) reported no evidence of persistence in fund outperformance after adjusting for both the well-known Fama-French (1993) three-factor model as well as momentum. More recently, Fama and French (2010) reported results of a separate 22-year study suggesting that it is extremely difficult for an actively managed investment fund to outperform its benchmark regularly.
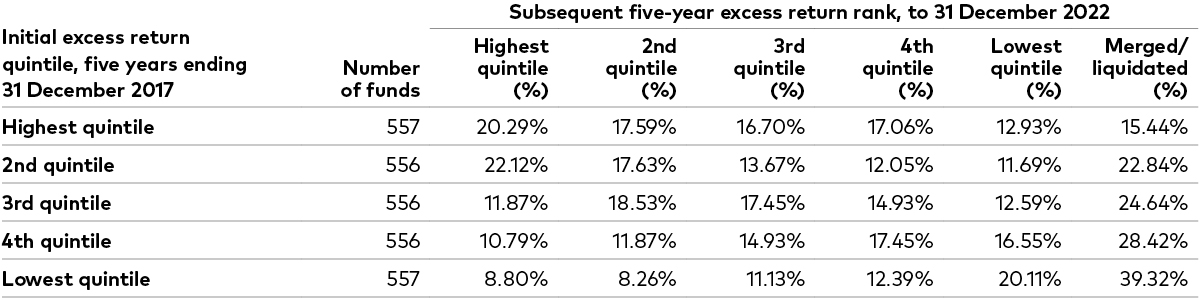
To test the persistency of active managers’ performance, we looked at two separate, sequential, non-overlapping five-year periods. Firstly, we ranked the funds by performance quintile in the first five-year period, with the top 20% of funds going into the first quintile, the second 20% into the second quintile and so on. Secondly, we sorted those funds by performance quintile according to their performance in the second five-year period. To the second five-year period, however, we added a sixth category: funds that were either liquidated or merged during that period. We then compared the results. If managers were able to provide consistently high performance, we would expect to see most first-quintile funds remaining in the first quintile. The figure below shows this not to be the case.
It is interesting to note that, once we accounted for closed and merged funds, persistence was actually stronger among the underperforming funds than those that outperformed. These findings were consistent across all asset classes and markets we studied globally. From this, we concluded that consistent outperformance is very difficult to achieve. This is not to say that there are not periods when active management outperforms, or that no active managers do so regularly, only that, on average and over time, active managers as a group fail to outperform. Even although some individual active managers may be able to generate consistent outperformance, they are extremely rare.
Actively managed domestic funds failed to show persistent outperformance
Past performance is no guarantee of future results.
Notes: The far left column ranks all active equity funds available in the UK based on their excess returns relative to their stated benchmark during the five year period as of the date listed. The remaining columns show how funds in each quintile performed over the next five years. NAV-based performance; returns calculated in GBP, net of fees income reinvested.
Source: Vanguard and Morningstar, Inc.
Complicating factors
Various circumstances can result in data that shows active management outperforming indexing at times and indexing outperforming active management by more than would be expected at other times. As a result, the case for low-cost index-fund investing can appear either less or more compelling than the theory would indicate. Below, we address some of these circumstances.
Survivorship bias can skew results
Survivorship bias is introduced when funds are merged into other funds or liquidated, and so are not represented throughout the full period examined. Because such funds tend to underperform, this skews the average results upward for the surviving funds, causing them to appear to perform better relative to a benchmark.
However, the average experience of investors – some of whom invested in the underperforming fund before it was liquidated or merged – may be very different.
Our analysis also found that the percentage of actively managed mutual funds available for sale in the UK that underperformed versus their prospectus and style benchmarks over one, three, five, 10 and 15 years showed a marked increase when ‘dead’ funds (those that were merged or liquidated during the period) were taken into account4.
Merged and liquidated funds have tended to be underperformers
In a study by Vanguard researchers5, we tested the assumption that closed funds underperformed by evaluating the performance of all domestic funds identified by Morningstar as being either liquidated or merged into another fund. We found that funds tended to trail their benchmark before being closed and that the assumption that merged and liquidated funds underperformed was reasonable.
In either case, we found that the share of active funds that underperformed tends to become more pronounced as the time period lengthens and survivorship bias is accounted for. Thus, it is critical to adjust for survivorship bias when comparing the performance of active funds to their benchmarks, especially over longer periods6.
Mutual funds are not the entire market
Another factor that can complicate the analysis of real-world results is that mutual funds, which are used as a proxy for the market in most studies (including this one), do not represent the entire market and therefore do not capture the entire zero-sum game.
Mutual funds are typically used in financial market research because their data tend to be readily available and because, in many markets, mutual fund assets represent a reasonable sampling of the overall market. In cases where mutual funds constitute a relatively smaller portion of the market being examined, the sample size studied will be that much smaller, and the results more likely to be skewed. Depending on the direction of the skew, this could lead to either a less favourable or a more favourable result for active managers overall.
Portfolio exposures can make relative performance more difficult to measure
Differences in portfolio exposures versus a benchmark or broader market can also make relative performance difficult to measure. Benchmarks are selected by fund managers on an ex-ante basis, and do not always reflect the style in which the portfolio is actually managed.
For example, during a period in which small- and mid-cap equities are outperforming, a large-cap manager may hold some of these stocks in the portfolio to increase returns7. Similarly, managers may maintain an over/underexposure to certain factors (size or style, for example) for the same reason. These portfolio tilts can cause the portfolio to either outperform or underperform when measured against the fund’s stated benchmark or broad market. Over a full market or factor cycle, we would expect the performance effects of these tilts to cancel out and the zero-sum game to be restored.
Short time periods can understate the advantage of low-cost index investing
Time is an important factor in investing. Transient forces such as market cycles and simple luck can more significantly affect a fund’s returns over shorter time periods. These short-term effects can mask the relative benefits of low-cost index funds versus active funds in two main respects: the performance advantage conferred on index funds over the longer term by their generally lower costs; and the lack of persistent outperformance among actively managed funds.
A short reporting period reduces low-cost index funds’ performance advantage because the impact of their lower costs compounds over time. For example, a 50-basis-point difference in fees between a low-cost and a higher-cost fund may not greatly affect the funds’ performance over the course of a single year; however, that same fee differential compounded over longer time periods can make a significant difference in the two funds’ overall performance.
Time also has a significant impact on the application of the zero-sum game. In any given year, the zero-sum game states that there will be some population of funds that outperforms the market. As the period examined becomes longer, the effects of luck and market cyclicality tend to cancel out, reducing the number of funds that outperform. Market cyclicality is an important factor in the lack of persistent outperformance as investment styles and market sectors go in and out of favour.
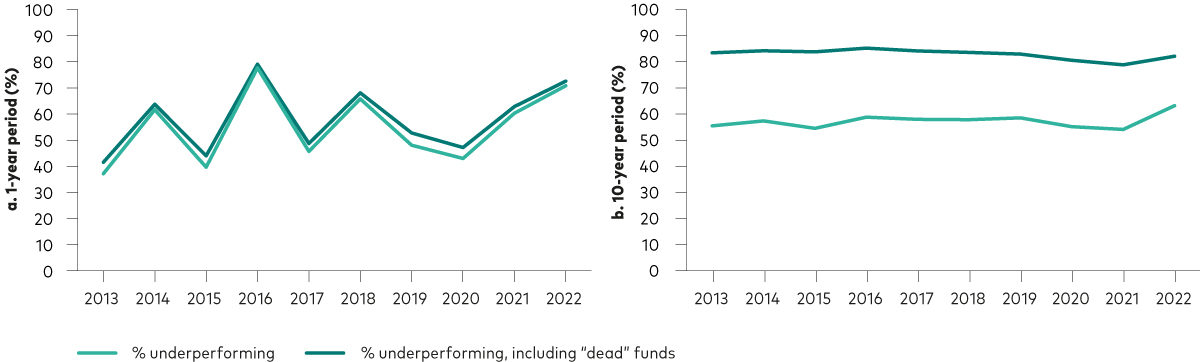
This concept is illustrated in the figure below, which compares the performance of domestic funds over rolling one- and 10-year periods to that of their benchmarks. As the data shows, active funds were much less likely to outperform over longer periods compared with shorter periods; this was especially true when merged and liquidated funds were included in the analysis. As the period examined became longer, the population of funds that consistently outperformed tended to shrink, ultimately becoming very small.
Percentage of active equity funds available in the UK underperforming over rolling period versus prospectus benchmark
Past performance is no guarantee of future results.
Notes: Performance is calculated relative to funds’ prospectus benchmarks. “Dead” funds are those that were merged or liquidated during the period. NAV-based performance; returns calculated in GBP, net of fees with income reinvested. Only funds available for sale in the UK are included.
Sources: Vanguard calculations using data from Morningstar, Inc. Performance is calculated relative to prospectus benchmark, observed from 31 December 2012 to 31 December 2022.
Low-cost indexing – a simple solution
One of the simplest ways for investors to gain market exposure with minimal costs is through a low-cost index fund or ETF. Index funds seek to provide exposure to a broad market or a segment of the market through varying degrees of index replication ranging from full replication (in which every security in the index is held) to synthetic replication (in which index exposure is obtained through the use of derivatives). Regardless of the replication method used, all index funds seek to track the target market as closely as possible and, by extension, to provide market returns to investors.
This is an important point and is why index funds, in general, offer investors market exposure at minimal cost. Index funds do not attempt to outperform their market, as many active managers do. As such, index funds do not require the significant investment of resources necessary to find and capitalise on opportunities for outperformance (such as research and increased trading costs) and therefore do not need to pass those costs onto their investors. By avoiding these costs, index funds are generally able to offer broad market exposure with market returns at very low cost relative to most actively managed funds.
Furthermore, because index funds do not seek to outperform the market, they do not face the challenges of either persistent outperformance or beating the zero-sum game. In short, by accepting market returns while keeping costs low, low-cost index funds lower the hurdles that make successful active management so difficult over the long term. That is why for most investors, we believe the best chance of successful investing over the long term lies in low-cost, broadly diversified index funds.
Although we believe that low-cost index funds offer most investors their best chance at maximising fund returns over the long run, we acknowledge that some investors want or need to pursue an active strategy. For example, investors in some markets may have few low-cost, domestic index funds available to them. For those investors, or any investor choosing an active strategy, low-cost, broadly diversified actively managed funds can serve as a viable alternative or a worthwhile addition to index funds. Since the performance advantage conferred by low-cost funds is quickly eroded as costs increase, in some cases, low-cost actively managed funds may prove superior to higher-cost index funds.
Key takeaways
Investing is a zero-sum game – for every investor who outperforms the market, there will be another or others who underperform by the same amount.
The costs of investing make outperforming the market significantly harder.
Funds that do outperform do not do so consistently.
The benefits of low-cost index fund investing are particularly evident over longer periods and when merged or liquidated active funds do not skew the outperformance of surviving funds.
To read more about how to help clients decide how they should allocate across index and active investments, see our article on the active/passive choice.
This is a summary of The Case for Low-cost Index-fund Investing by Dr. Stephen Lawrence and Dr. Jan-Carl Plagge published in May 2023. The paper is a revision of Vanguard research first published in 2004 as The Case For Indexing by Nelson Wicas and Christopher B. Philips. The authors acknowledge the various authors who have contributed to prior versions of this research.
1 S&P Dow Jones Indices, 2022. SPIVA US Scorecard (Year-End 2022).
2 Rowley Jr., James J., and David T. Kwon, 2015. The Ins and Outs of Index Tracking. Journal of Portfolio Management 41(3): 35–45.
3 Vanguard calculations, based on data from Morningstar, Inc. NAV-based performance; returns calculated in GBP, net of fees with income reinvested, based on ten-year annualised excess return relative to stated benchmarks as at 31 December 2022.
4 Vanguard calculations, using data from Morningstar, Inc., MSCI, FTSE and Bloomberg. Fund performance in GBP terms, net of fees, gross of withholding tax, with income reinvested, based on closing NAV prices as at 31 December 2022.
5 For a more detailed discussion of the underperformance of closed funds, see Schlanger and Philips (2013).
6 It can also be useful to consider performance results in terms of asset-weighted performance. In doing so, larger funds account for a larger share of the results because they reflect a larger proportion of investors’ assets. This can give a clearer perspective on how investors collectively performed and is consistent with the zero-sum game theory as it relates to aggregate fund performance.
7 Thatcher, William R., 2009. When Indexing Works and When It Doesn’t in US Equities: The Purity Hypothesis. Journal of Investing 18(3): 8–11.

If you have completed all content in the module, you are ready to take the quiz and collect your CPD
Ready to test your knowledge?
Take the quizOther Vanguard 365 pillars
Practice management
CPD content designed to help you build your practice, market your services effectively and cultivate a thriving professional network.
Client relationships
CPD content crafted to empower you to service your client’s needs effectively, build relationships, create loyalty and achieve new business growth.
Financial planning
CPD content structured to give you access to useful tools, guides and multimedia resources covering diverse topics from risk profiling to retirement planning.
Investment risk information
The value of investments, and the income from them, may fall or rise and investors may get back less than they invested.
Important information
This article is designed for use by, and is directed only at persons resident in the UK.
The information contained in this article is not to be regarded as an offer to buy or sell or the solicitation of any offer to buy or sell securities in any jurisdiction where such an offer or solicitation is against the law, or to anyone to whom it is unlawful to make such an offer or solicitation, or if the person making the offer or solicitation is not qualified to do so. The information in this document does not constitute legal, tax, or investment advice. You must not, therefore, rely on the content of this article when making any investment decisions.
The information contained in this article is for educational purposes only and is not a recommendation or solicitation to buy or sell investments.
© 2025 Vanguard Asset Management, Limited. All rights reserved.
Vanguard Asset Management, Limited is authorised and regulated in the UK by the Financial Conduct Authority.