- Bond yields broadly rose in October, as stronger labour market data led to questions about the path of future Fed rate cuts.
- Government bond yields rose, with two- and 10-year US Treasury yields increasing by 53 bps and 50 bps, respectively.
- Investment-grade credit spreads broadly tightened over the month.
Fixed income markets broadly retreated in October, driven by stronger US labour market data and uncertainty around the US presidential election. US Treasury yields continued to rise, as strong non-farm payrolls data led to markets repricing their expectations around Federal Reserve (Fed) interest rate cuts. The US dollar continued to strengthen, rising to its strongest levels since July1.
In the euro area, economic growth exceeded expectations in Q3, increasing 0.4%. Spain was a key driver, while Germany also recorded surprise growth of 0.2%, avoiding a technical recession. In the UK, Chancellor Rachel Reeves announced the Autumn Budget, which drove some volatility in the gilt market as investors digested plans for further investment and stimulus.
Inflation across developed markets broadly slowed. In the US, headline inflation softened marginally to 2.5%, while core inflation, which excludes volatile food, energy, alcohol and tobacco prices, rose to 3.3%. In the UK, headline inflation fell to 1.7%—below the Bank of England’s target for the first time in over three years—while core inflation declined to 3.2%. In Europe, headline inflation rose more than expected to 2%, while core inflation remained steady at 2.7%.
The European Central Bank cut interest rates by a further 25 basis points (bps) in October, but continued to stress its data-dependent approach. President Christine Lagarde noted the likelihood of inflation rising before it starts to come down once more, driven by base effects.
Monthly performance by market
| Global government bonds | Corporate bonds | Emerging market bonds | |||
| UK | Europe | US | HY | ||
| Bloomberg Global Aggregate Treasuries (USD Hedged) | Bloomberg Sterling Corporate Bond Index (USD Hedged) | Bloomberg Euro-Aggregate Corporates Index (USD Hedged) | Bloomberg Global Aggregate USD Corporate (USD Hedged) | Bloomberg Global High Yield Index (USD Hedged) | JP Morgan Emerging Markets Bond Index EMBI Global Diversified (USD Hedged) |
| -1.22% | -1.18% | -0.15% | -2.27% | -0.07% | -1.72% |
Past performance is no guarantee of future returns. The performance of an index is not an exact representation of any particular investment, as you cannot invest directly in an index.
Source: Bloomberg, for the period 30 September 2024 to 31 October 2024. Bloomberg indices are used as proxies for each exposure2.
Government bonds
Government bond yields broadly rose in October, due to stronger inflation and labour market data in the US, as well as volatility related to the US elections. In the US, 2- and 10-year yields rose by 53 bps and 50 bps, respectively. In the euro area, German two-year Bund yields rose by 21 bps, while 10-year yields rose by 27 bps. In the UK, two- and 10-year gilt yields rose by 46 bps and 44 bps, respectively3.
Credit markets
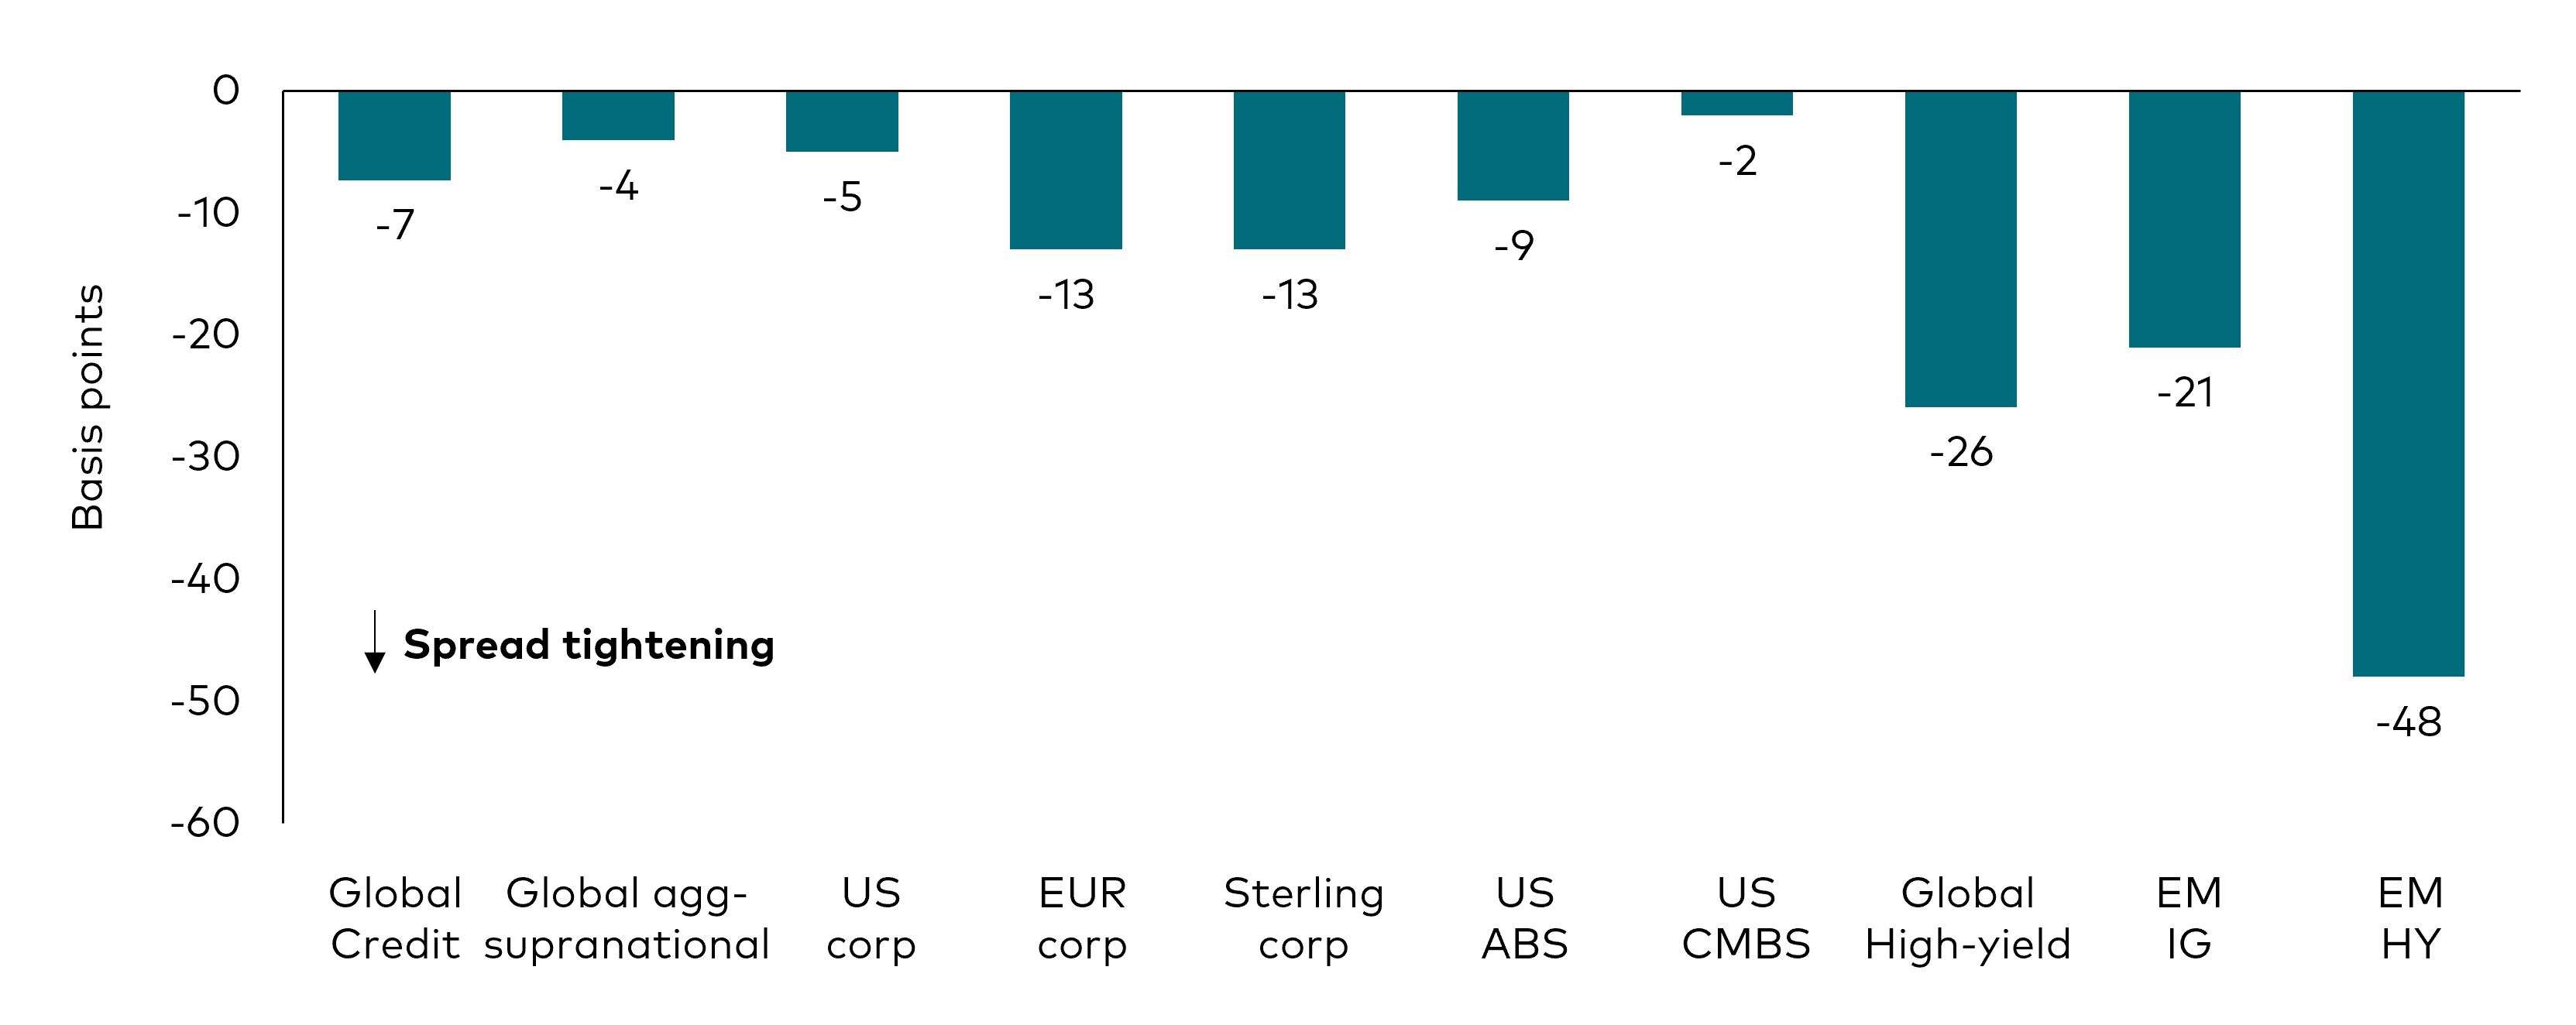
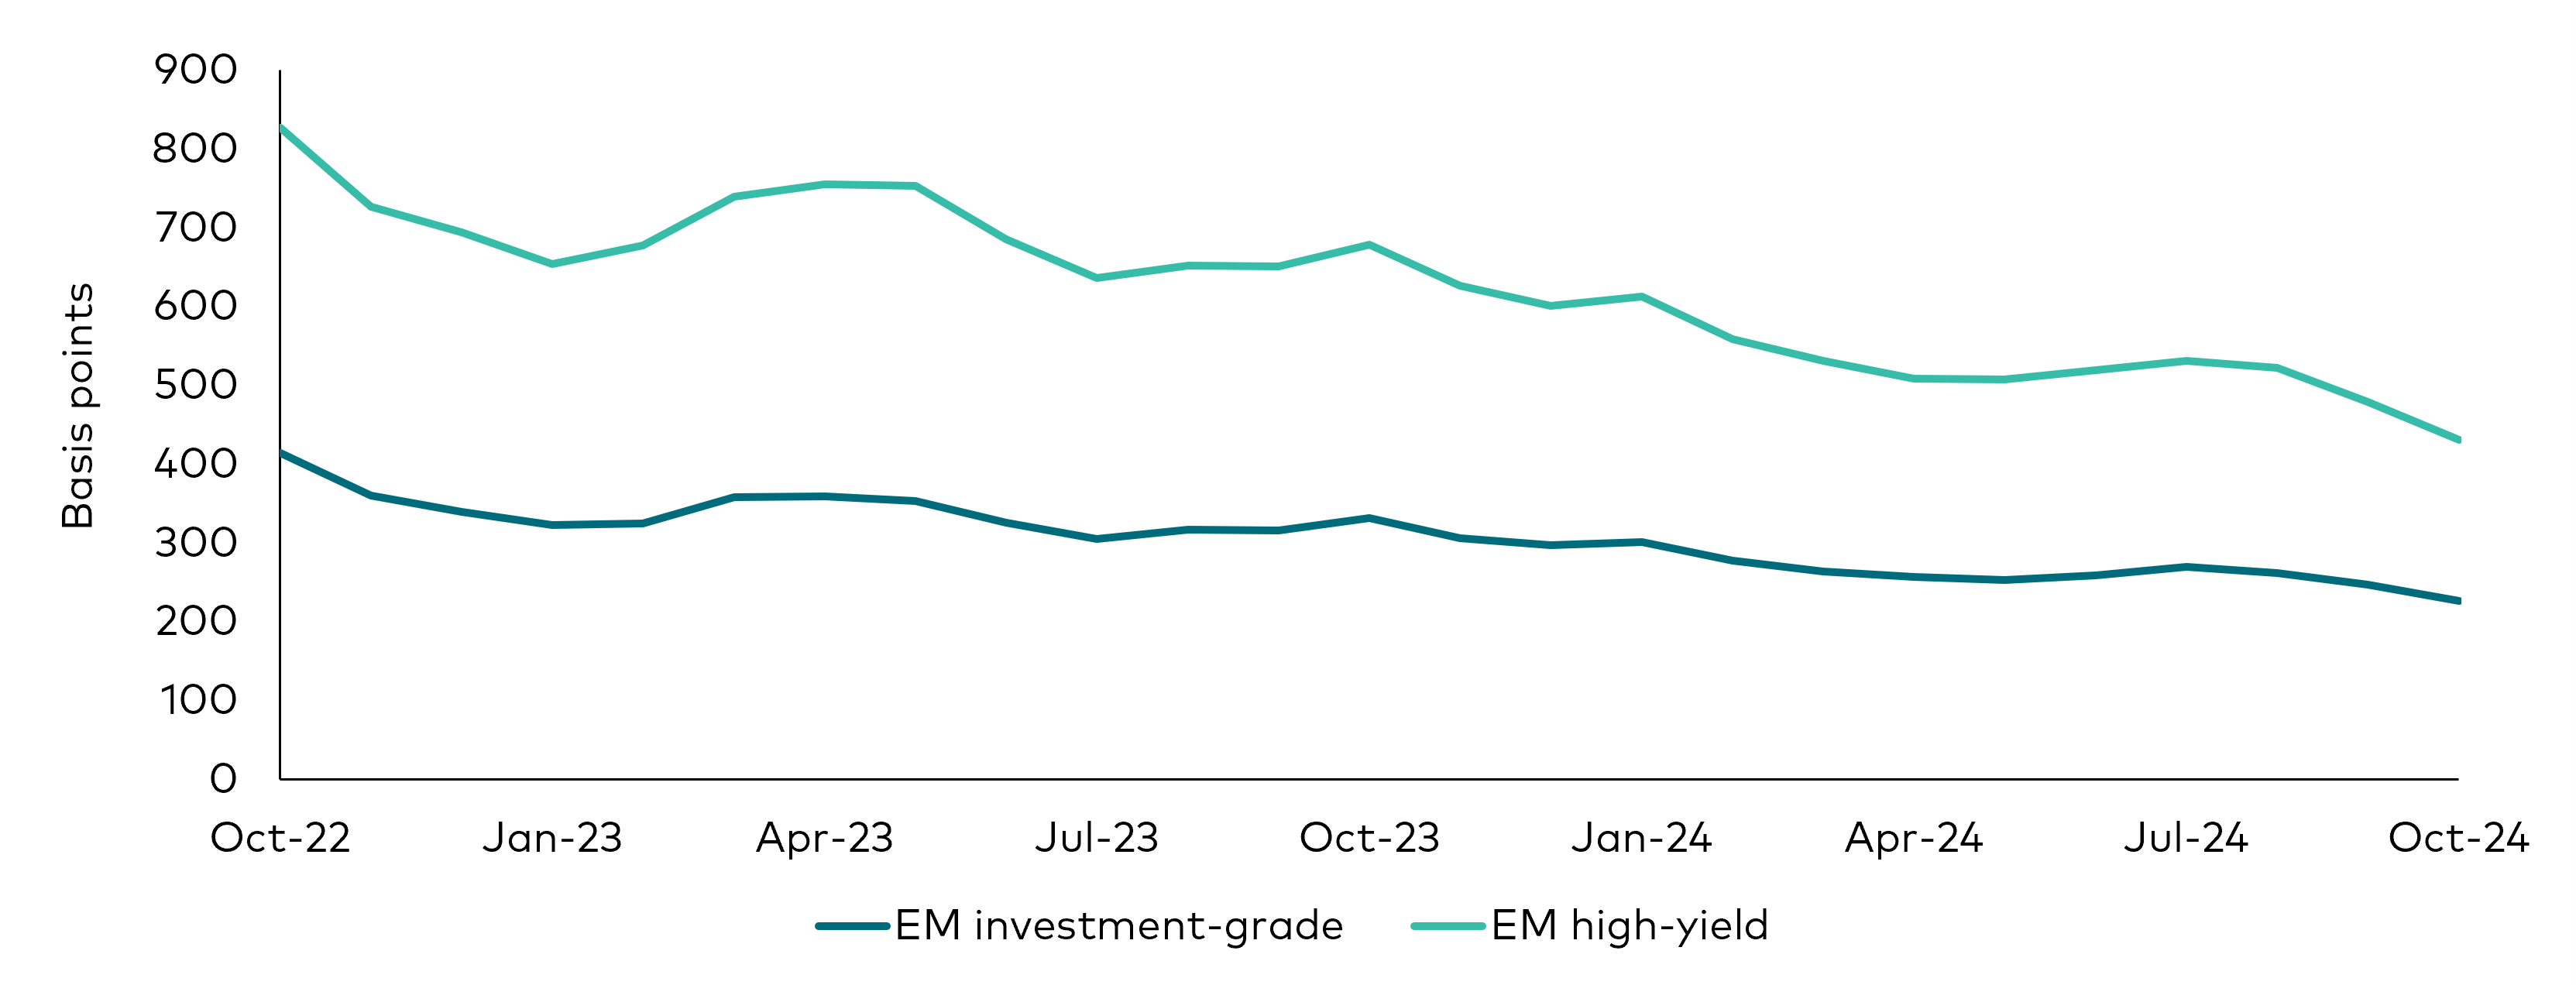
Investment-grade spreads broadly tightened over the month, with US, euro and sterling investment-grade spreads tightening by 5 bps, 13 bps and 13 bps, respectively4. The spread compression was more prominent in emerging markets (EM), with EM investment-grade and EM high-yield spreads contracting by 21 bps and 48 bps, respectively over the month5.
Changes in spreads

Past performance is no guarantee of future returns. The performance of an index is not an exact representation of any particular investment, as you cannot invest directly in an index.
Source: Bloomberg, for the period 30 September 2024 to 31 October 2024. Proxies used for each exposure6.
Third-quarter corporate earnings season is in full swing. So far, we haven’t seen any major negative surprises, outside of the known weak spots. The consumer discretionary sector continued to report subdued demand in key markets like China and, to a lesser extent, Europe and the US. The automobile sector also continued to struggle7.
Our base case remains that revenue and earnings growth will improve over the coming quarters, as the rate-cutting cycle boosts consumer confidence and stimulates economic activity. However, geopolitical tensions pose a downside risk to the 2025 recovery scenario. Another risk is the potential resurfacing of inflationary pressures if a sharp increase in global freight prices feeds into higher goods prices. Overall, we remain of the view that investment-grade company fundamentals are in good shape thanks to the deleveraging by corporates over the past few years.
The technical outlook remains positive. Since the beginning of the year, we have observed steady inflows into investment-grade credit. With central banks now on a cutting path and credit yields still at attractive levels, we expect demand for credit to remain strong.
Emerging markets
EM credit bonds declined -1.7% in October, as the impact of the sell-off in US Treasuries (-2.8%) overwhelmed more positive spread returns (+1.1%)8. EM investment-grade credit (-3.0%) notably underperformed EM high-yield bonds (-0.5%) over the month, due to the stronger influence of US Treasury declines on investment-grade returns, as well as the positive impact of improvements in distressed credits, such as Argentina, on EM high-yield returns9.
EM investment-grade and high-yield spreads

Source: Bloomberg and Vanguard. For the 24 months to 30 October 2024. Proxies used: EM investment-grade: Bloomberg EM USD Aggregate Average OAS Index; EM high-yield: Bloomberg Emerging Markets High Yield Average OAS Index.
Outlook
We believe yields are attractive. Historically, yields at these levels have typically been followed by strong returns over the subsequent six to 12 months.
In credit, spreads are consistent with a soft-landing narrative. In the US, we are continuing to see a healthy consumer, although the market is noting some dislocation between lower- and higher-income segments. Despite lacklustre growth in Europe, we expect company fundamentals to remain resilient as they are starting from a strong base and many issuers have deleveraged over the last few years. Technicals also remain strong, with robust demand for the asset class and supply likely to remain limited. Global credit currently yields more than cash, and is likely to outperform cash considerably if further rate cuts get priced in.
Within investment-grade credit, we are starting to see European investment-grade credit mean-revert, although we still view it as more attractive than US investment-grade. In high-yield corporates, technicals are still strong, though less favourable than in recent times. We saw a pick-up in rising star activity this year compared with fallen angels10, but this is starting to normalise. There has been some spread compression within the sector, with CCC-rated bonds outperforming B and BB-rated bonds11, although, overall, valuations still appear stretched. A recessionary outcome would see lower-quality sectors become more vulnerable; however, yields at current levels would likely offset some of the potential spread widening.
We are constructive on EM fixed income, as fundamentals are strong and yields are attractive. We believe a US rate-cutting cycle should be supportive for the asset class so long as global growth remains resilient. Nevertheless, valuations are tight and economic uncertainty remains a risk.
1 Source: Bloomberg and Vanguard, as at 31 October 2024.
2 Source: Bloomberg and Vanguard. Based on the Bloomberg Global Aggregate Credit Index, for the period 30 September 2024 to 31 October 2024.
3 Source: Bloomberg and Vanguard, for the period 30 September 2024 to 31 October 2024.
4 Source: Bloomberg and Vanguard. Based on the Bloomberg Global Aggregate Credit Index, for the period 30 September 2024 to 31 October 2024.
5 Source: Bloomberg and Vanguard. Based on the Bloomberg EM USD Aggregate Average OAS Index and Bloomberg Emerging Markets High Yield Average OAS Index, for the period 30 September 2024 to 31 October 2024.
6 Source: Bloomberg indices: Global Aggregate Credit Average OAS Index, Global Aggregate Supranational Index, US Aggregate Corporate Average OAS Index, Euro Aggregate Corporate Average OAS Index, Sterling Aggregate Corporate Average OAS Index, US Aggregate ABS Average OAS Index, US Aggregate CMBS Average OAS Index, Global High Yield Average OAS Index, JP Morgan EMBI Global Diversified IG Sovereign Spread Index, JP Morgan EMBI Global Diversified HY Sovereign Spread Index. Data for the period 30 September to 31 October 2024.
7 Source: Bloomberg and Vanguard, based on corporate earning results for the reporting period 1 July 2024 to 30 September 2024.
8 Source: Vanguard and JP Morgan. Based on the JP Morgan Emerging Market Bond Index (EMBI) Global Diversified relative to US Treasuries, for the period 31 September 2024 to 31 October 2024.
9 Source: Bloomberg and Vanguard. Based on the Bloomberg Emerging Markets USD Aggregate Average Option Adjusted Spread (OAS) Index and Bloomberg Emerging Markets High Yield Average OAS Index, for the period 30 September 2024 to 31 October 2024.
10 ‘Rising stars’ refer to high-yield issuers whose credit ratings have been upgraded from sub-investment grade (Ba1/BB+ or lower) to investment-grade (Baa3/BBB- or above) by ratings agencies S&P, Moody’s and Fitch. ‘Fallen angels’ refer to investment-grade issuers whose ratings have been downgraded to below investment-grade. An increase in rising-star versus falling-angel activity can signal a strengthening economic environment and/or improved corporate fundamentals.
11 Source: Bloomberg and Vanguard, for the period 1 January 2024 to 31 October 2024.
Our active bond funds managed in-house
Investment risk information
The value of investments, and the income from them, may fall or rise and investors may get back less than they invested.
Past performance is not a reliable indicator of future results.
Some funds invest in emerging markets which can be more volatile than more established markets. As a result the value of your investment may rise or fall.
Funds investing in fixed interest securities carry the risk of default on repayment and erosion of the capital value of your investment and the level of income may fluctuate. Movements in interest rates are likely to affect the capital value of fixed interest securities. Corporate bonds may provide higher yields but as such may carry greater credit risk increasing the risk of default on repayment and erosion of the capital value of your investment. The level of income may fluctuate and movements in interest rates are likely to affect the capital value of bonds.
Reference in this document to specific securities should not be construed as a recommendation to buy or sell these securities, but is included for the purposes of illustration only.
Important information
For professional investors only (as defined under the MiFID II Directive) investing for their own account (including management companies (fund of funds) and professional clients investing on behalf of their discretionary clients). In Switzerland for professional investors only. Not to be distributed to the public.
The information contained in this document is not to be regarded as an offer to buy or sell or the solicitation of any offer to buy or sell securities in any jurisdiction where such an offer or solicitation is against the law, or to anyone to whom it is unlawful to make such an offer or solicitation, or if the person making the offer or solicitation is not qualified to do so. The information in this document does not constitute legal, tax, or investment advice. You must not, therefore, rely on the content of this document when making any investment decisions.
The information contained in this document is for educational purposes only and is not a recommendation or solicitation to buy or sell investments.
Issued in EEA by Vanguard Group (Ireland) Limited which is regulated in Ireland by the Central Bank of Ireland.
Issued in Switzerland by Vanguard Investments Switzerland GmbH.
Issued by Vanguard Asset Management, Limited which is authorised and regulated in the UK by the Financial Conduct Authority.
© 2024 Vanguard Group (Ireland) Limited. All rights reserved.
© 2024 Vanguard Investments Switzerland GmbH. All rights reserved.
© 2024 Vanguard Asset Management, Limited. All rights reserved.
