- In recent years, it would have been difficult to keep up with the return of the US equity market without holding the companies that had the highest positive contribution, above all the so-called Magnificent 7.
- But looking into the past shows that there have been periods when not holding the worst contributors to index returns was more beneficial than holding the best contributors.
- Our findings should serve as a reminder of the difficulty of successfully timing the market and the importance of diversification.
Is it more important to hold the top contributors to index returns, or to not hold the worst contributors? Our recent analysis has revealed that the answer to this question can depend on the time period – and it also highlights the difficulty of successfully timing the market.
Quantifying the Magnificent 7’s contribution
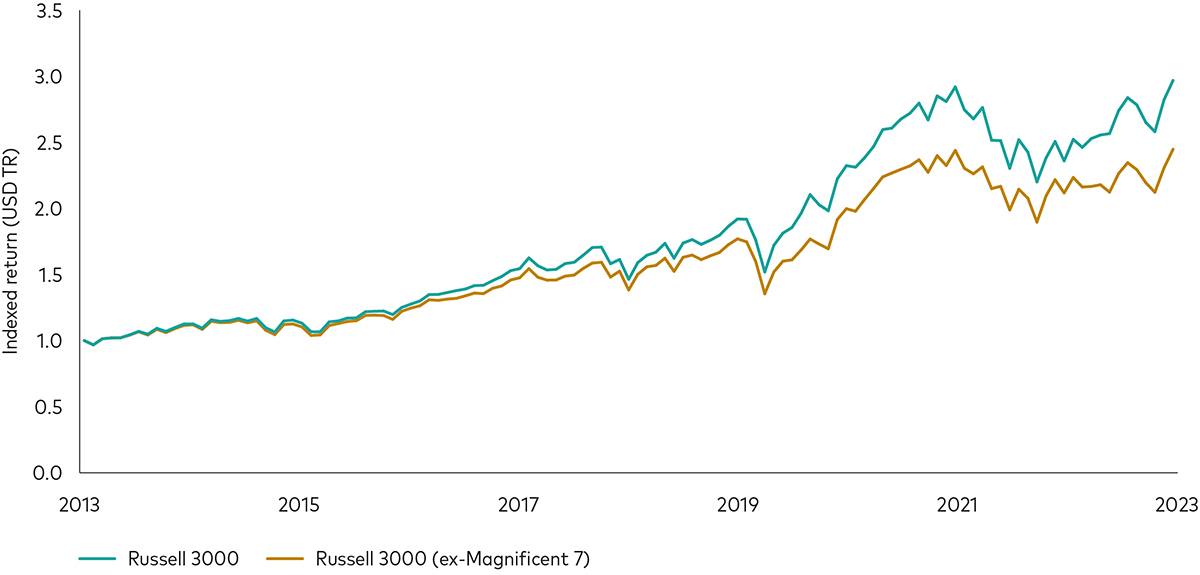
Most investors have likely heard about the "Magnificent 7,” with some expressing concern that these companies have made the equity market too concentrated1. However, avoiding these companies due to concentration concerns would have been detrimental to performance because of their contribution to the market’s return. In fact, as the chart below shows, a simulation of the Russell 3000 Index without these seven companies would have lagged the back-tested Russell 3000 Index by approximately 2.1% per annum over the past 10 years2.
Not holding the Magnificent 7 would have harmed total return

Source: Vanguard, FactSet, for the period 31 December 2013 to 31 December 2023. Performance is total return in US dollars. Russell 3000 (ex-Magnificent 7) is represented by the constituents of the Russell 3000 Index excluding Alphabet, Amazon, Apple, Meta Platforms, Microsoft, Nvidia and Tesla.
While investors would have been worse off had they not held these top contributors in recent years, an important question arises: has it always been more important to hold the top contributors to index returns or have there been times when it was more important to not hold the worst contributors?
To answer this question, we first replicated the Russell 3000 Index over the 24 years ending in December 2023. We then split those 24 years into 12 two-year sub-periods and calculated the contribution of every individual stock to the index’s return3.
Understanding the effect of not holding the best and worst contributors
The contribution of a stock to an index’s return is generally determined by the product of its weight and return. In our analysis, we add the additional effect stemming from redistributing an excluded stock’s weight across all other stocks in the portfolio. Hence, a stock that contributes the most to the index’s return, either positively or negatively, is not necessarily the stock that performed the best or the worst. Rather, it is the stock that had the most impactful combination of weight and return relative to the opportunity of holding the remaining, reproportioned stocks in a portfolio.
Our analysis had two basic steps. First, we ranked each stock from best to worst according to its contribution. Next, from both sides of the contribution distribution, we excluded the best/worst contributing stocks in groups of varying number.
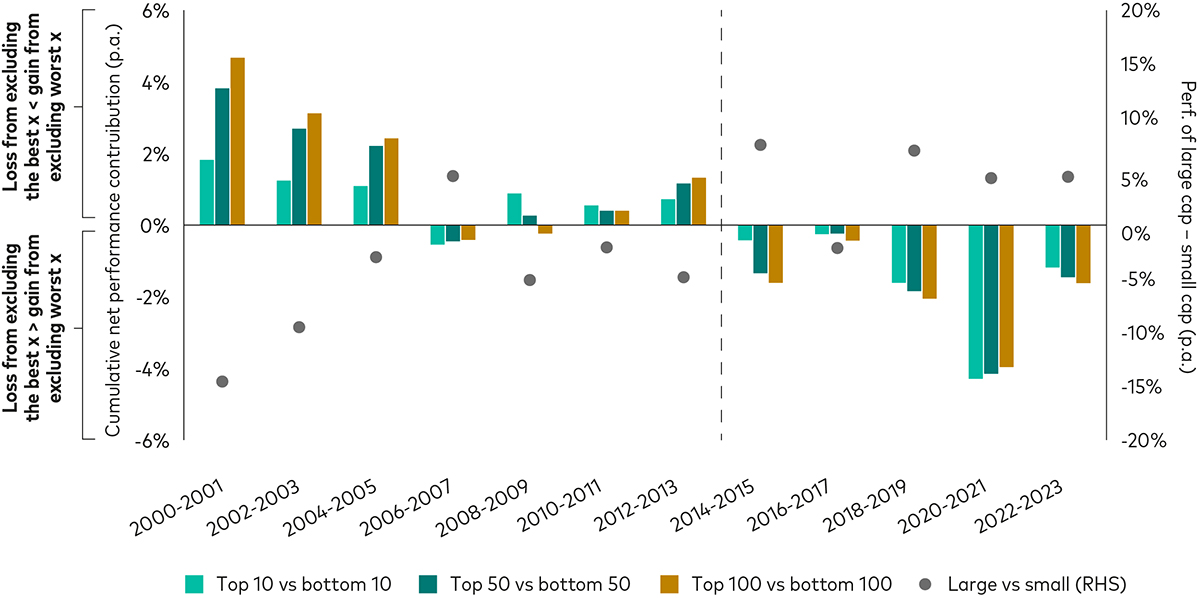
The bars in the chart below show the resulting net difference of the performance effect for groups of the best and worst 10, 50 and 100 stocks. A positive bar indicates that the gain from not holding the worst contributors exceeded the loss from not holding the best contributors. Conversely, a negative bar indicates that the loss from not holding the best contributors exceeded the gain from not holding the worst contributors.
When looking across all 12 two-year periods, we note an interesting pattern. While it appears to have been more important to hold the best contributing stocks in recent years, it was actually more impactful to not hold the worst contributing stocks in the early years of our study.
Not holding the best versus not holding the worst contributing stocks

Source: Vanguard, FactSet, for the period 31 December 1999 to 31 December 2023. Performance is total return in US dollars.
The dots on the chart suggest that the pattern coincides with the return of large cap versus small cap stocks4. If large caps underperform small caps, the gain from not holding the bottom performers tends to exceed the loss from not holding the top contributors. Conversely, if large caps outperform small caps, the loss from not holding the top contributors tends to exceed the gain from not holding the bottom contributors. Hence, the “direction of travel” is, to a significant extent, determined by large cap stocks. This makes intuitive sense as contribution is, as defined above, given by weight multiplied by return. Therefore, all else being equal, the higher the weight of a stock, the higher its contribution.
The challenge of market timing and the importance of diversification
Our findings should serve as a reminder of the difficulty of successfully timing the market and the importance of diversification.
In recent years, it would have been difficult to keep up with the return of the US equity market without holding those companies that had the highest positive contribution – above all, the Magnificent 7. And diversification reduces the likelihood of not holding tomorrow’s top positive contributors.
Of course, had an investor correctly predicted the (change in) relative performance of large caps versus small caps or the rise of the Magnificent 7, that investor would have easily outperformed the market over the course of our study period. However, we know from numerous studies on the performance of professionally managed active funds that the vast majority of these funds fail to beat their more diversified benchmarks over time5. This tendency demonstrates that knowing which stocks will perform well in the future is very difficult to do. And for investors who want to avoid the risk associated with stock selection and market timing, holding the entire market—rather than subsets of it—can offer the best chance of successfully investing over the long term.
1 In our context, Magnificent 7 refers to the companies Alphabet, Amazon, Apple, Meta Platforms, Microsoft, Nvidia and Tesla.
2 Using monthly holdings data, market capitalisation and return data from FactSet, we approximate the Russell 3000 Index, a universe of US equities, for our study.
3 Specifically, we calculate the contribution of individual stocks to the Russell 3000 Index by subtracting the return of the “Russell 3000 Index excluding stock n” with that of the Russell 3000 Index itself. The “Russell 3000 Index excluding stock n” is calculated by distributing the weight of the excluded stock across all remaining stocks in proportion to their market capitalisation.
4 The return of large caps is simulated by the return of the largest third of stocks in our Russell 3000 Index replication while the return of small caps is simulated by the market-weighted return of the smallest two-thirds of our Russell 3000 Index simulation.
5 Source: Vanguard, The case for low-cost index-fund investing, 2024.
Related ETFs
Investment risk information
The value of investments, and the income from them, may fall or rise and investors may get back less than they invested.
Past performance is not a reliable indicator of future results.
Simulated past performance is not a reliable indicator of future results.
Important information
For professional investors only (as defined under the MiFID II Directive) investing for their own account (including management companies (fund of funds) and professional clients investing on behalf of their discretionary clients). In Switzerland for professional investors only. Not to be distributed to the public.
The information contained herein is not to be regarded as an offer to buy or sell or the solicitation of any offer to buy or sell securities in any jurisdiction where such an offer or solicitation is against the law, or to anyone to whom it is unlawful to make such an offer or solicitation, or if the person making the offer or solicitation is not qualified to do so. The information does not constitute legal, tax, or investment advice. You must not, therefore, rely on it when making any investment decisions.
The information contained herein is for educational purposes only and is not a recommendation or solicitation to buy or sell investments.
Issued in EEA by Vanguard Group (Ireland) Limited which is regulated in Ireland by the Central Bank of Ireland.
Issued in Switzerland by Vanguard Investments Switzerland GmbH.
Issued by Vanguard Asset Management, Limited which is authorised and regulated in the UK by the Financial Conduct Authority.
Issued in EEA by Vanguard Group Europe Gmbh, which is regulated in Germany by BaFin.
© 2024 Vanguard Group (Ireland) Limited. All rights reserved.
© 2024 Vanguard Investments Switzerland GmbH. All rights reserved.
© 2024 Vanguard Asset Management, Limited. All rights reserved.
© 2024 Vanguard Group Europe GmbH. All rights reserved.
